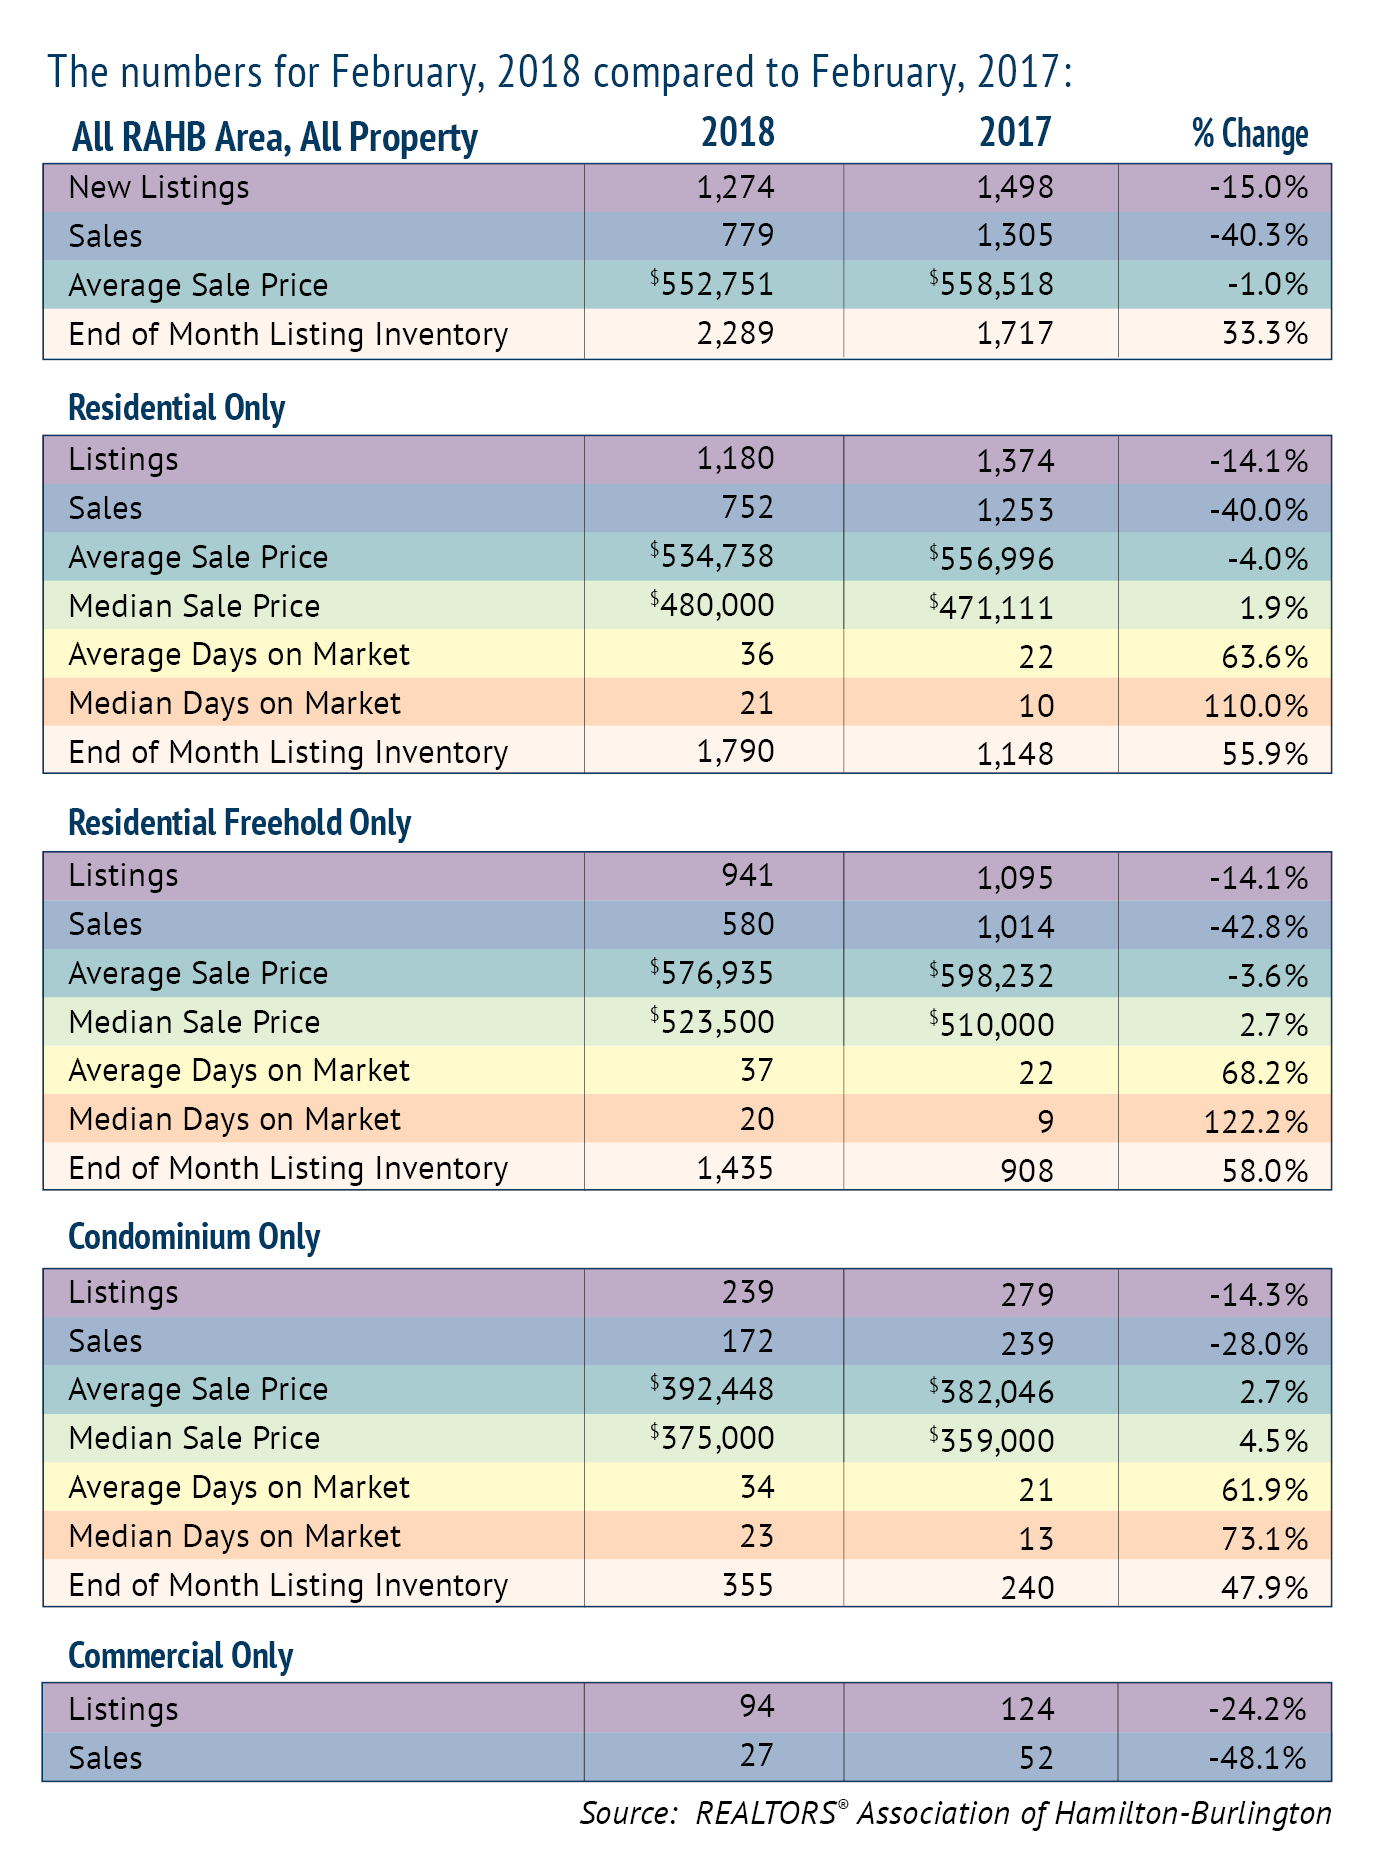
The REALTORS® Association of Hamilton-Burlington (RAHB) reported 779 sales were processed through the RAHB Multiple Listing Service® (MLS®) System in February, 40.3 per cent fewer than the same month last year and 25.7 per cent lower than the 10-year average for the month.
All property listings were 15 per cent lower than the same month last year and 21.4 per cent lower than the 10-year average.
“February’s real estate market experienced a significant slowdown, and that’s compared not just to last year, but to the last 10 to 15 years as well,” said RAHB CEO George O’Neill. “In fact, the number of new listings was the lowest in the last 15 years and the number of sales was the second-lowest in that same 15 year period.”
Seasonally adjusted* sales of residential properties were 38.9 per cent lower than the same month last year, with the average sale price down 0.2 per cent for the month. Seasonally adjusted numbers of new listings were 12.6 per cent lower than February of 2017.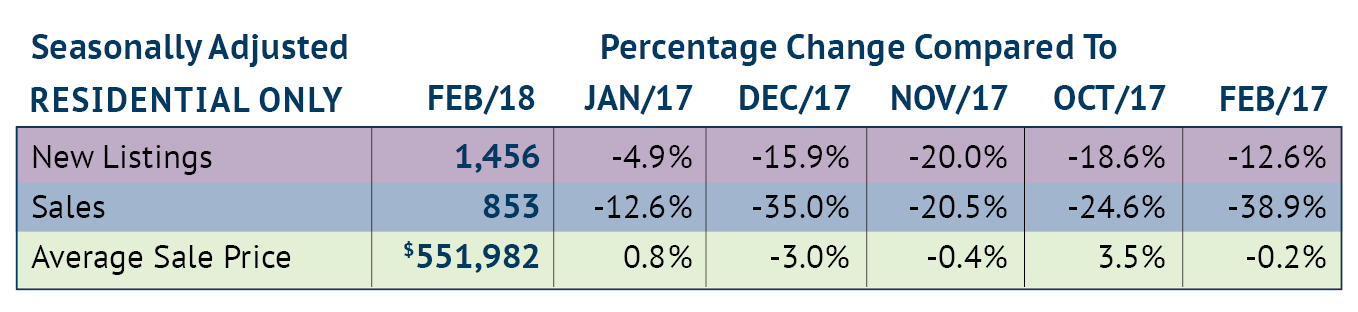
Overall residential sales of 752 units were 40 per cent lower than February last year. Residential freehold sales were 42.8 per cent lower than the same month last year while sales in the condominium market were 28 per cent lower.
The median price of freehold properties increased by 2.7 per cent over the same month of the previous year while the median price for condominium properties increased by 4.5 per cent compared to the same period.
The average price of freehold properties was 3.6 per cent lower than in February 2017; the average sale price in the condominium market increased by 2.7 per cent compared to the same period.
Average sale price is based on the total dollar volume of all properties sold through the RAHB MLS® System. Average sale price can be useful in establishing long-term trends, but should not be used as an indicator that specific properties have increased or decreased in value. Contact a REALTOR® for information about your specific neighbourhood or property.
“Prices in both the freehold and condominium markets have moderated from the year-over-year increases we saw through the last couple of years,” added O’Neill. “Condo prices showed gains in both average and median prices, but the freehold market saw a dip in average sale price and an increase in the median price.”
The average number of days on market increased to 37 days from 22 days in the freehold market and increased to 34 days from 21 days in the condominium market, compared to the same month last year.
““While the days on market has increased substantially from last February, you have to remember that last February was a remarkably active month with record sales for the month. In fact, February 2017 sales were 27.7 per cent higher than the 10-year average.” noted O’Neill. “This February, the average time it took to sell a listed property actually followed the normal pattern for the month – that is, it was lower than it was in January. With the sales-to-new-listings ratio still in the low end of seller’s market, I expect that, like most years, we are seeing the sprouting of the spring market that we usually see in February.”
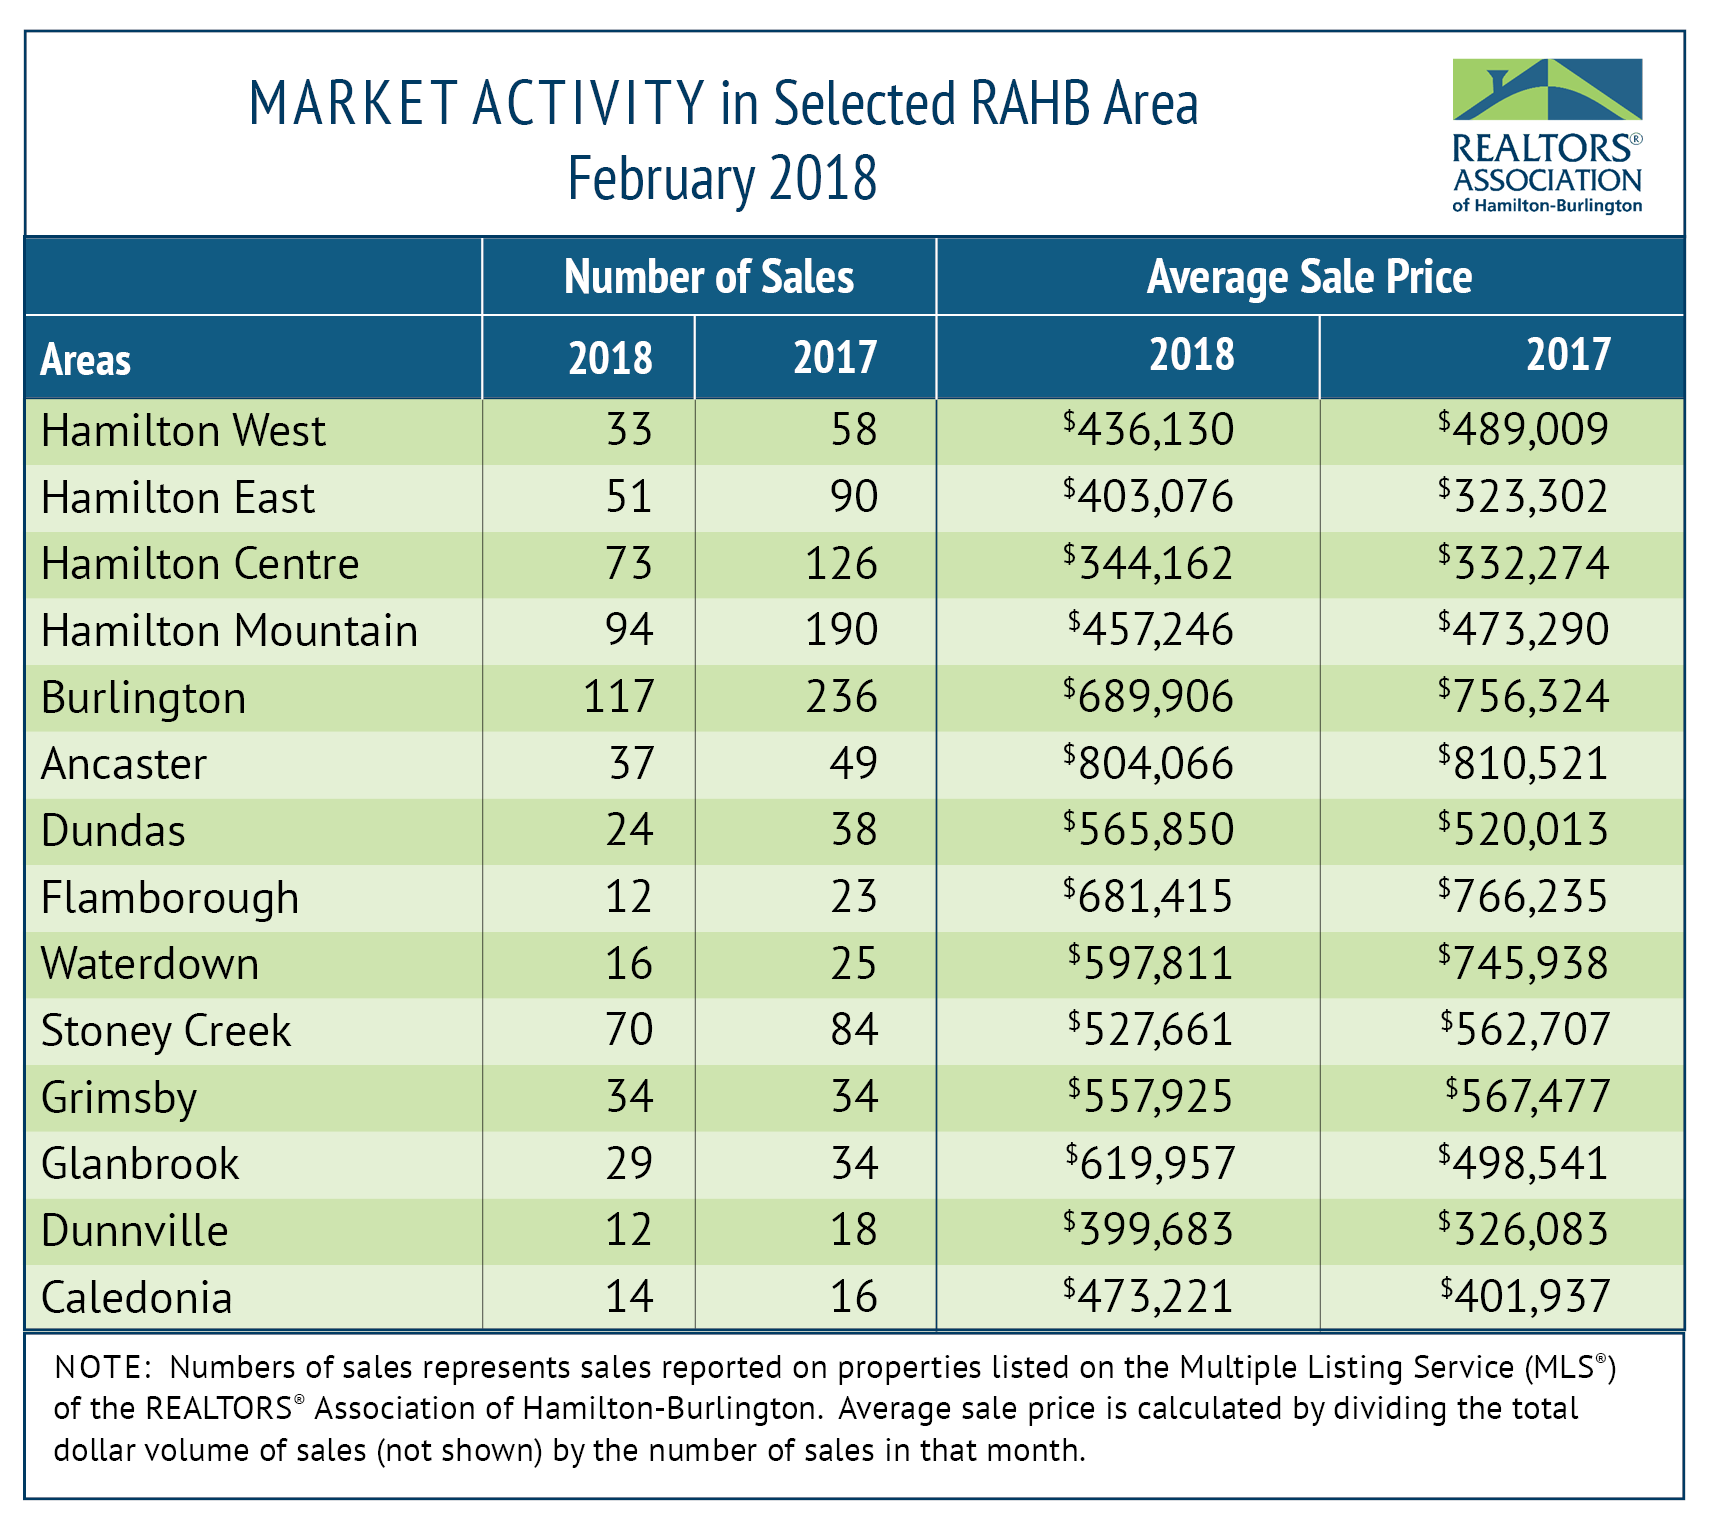
Every community in RAHB’s market area has its own localized market. Refer to the accompanying chart, and please ensure you contact a local REALTOR® for professional advice.
*Seasonal adjustment removes normal seasonal variations, enabling analysis of monthly changes and fundamental trends in the data.
Monthly Sales Statistics Breakdown: