The REALTORS® Association of Hamilton-Burlington (RAHB) reported 1624 sales processed through the RAHB Multiple Listing Service® (MLS®) System in July. While this was no record-breaking month, sales were still 4.4 per cent higher than the same month last year and 27.1 per cent higher than the historical 10-year average.
There were 1,968 properties listed in July, a decrease of just under one per cent compared to the same month the year prior. The lower number of listings plus the increase in sales left the end-of-month listing inventory 13.7 per cent lower than last July.
“It’s still all about lack of inventory,” said RAHB CEO Ross Godsoe. “After three record-breaking months in a row, there is just over two months of listing inventory – a sure indicator of a continued seller’s market.”
Seasonally adjusted* sales of residential properties were 5.9 per cent higher than the same month of the previous year, with the average sale price up 5.7 per cent for the month. Seasonally adjusted numbers of new listings were six per cent higher than the same month the year prior.
Seasonally adjusted data for residential properties for the month of July, 2015:

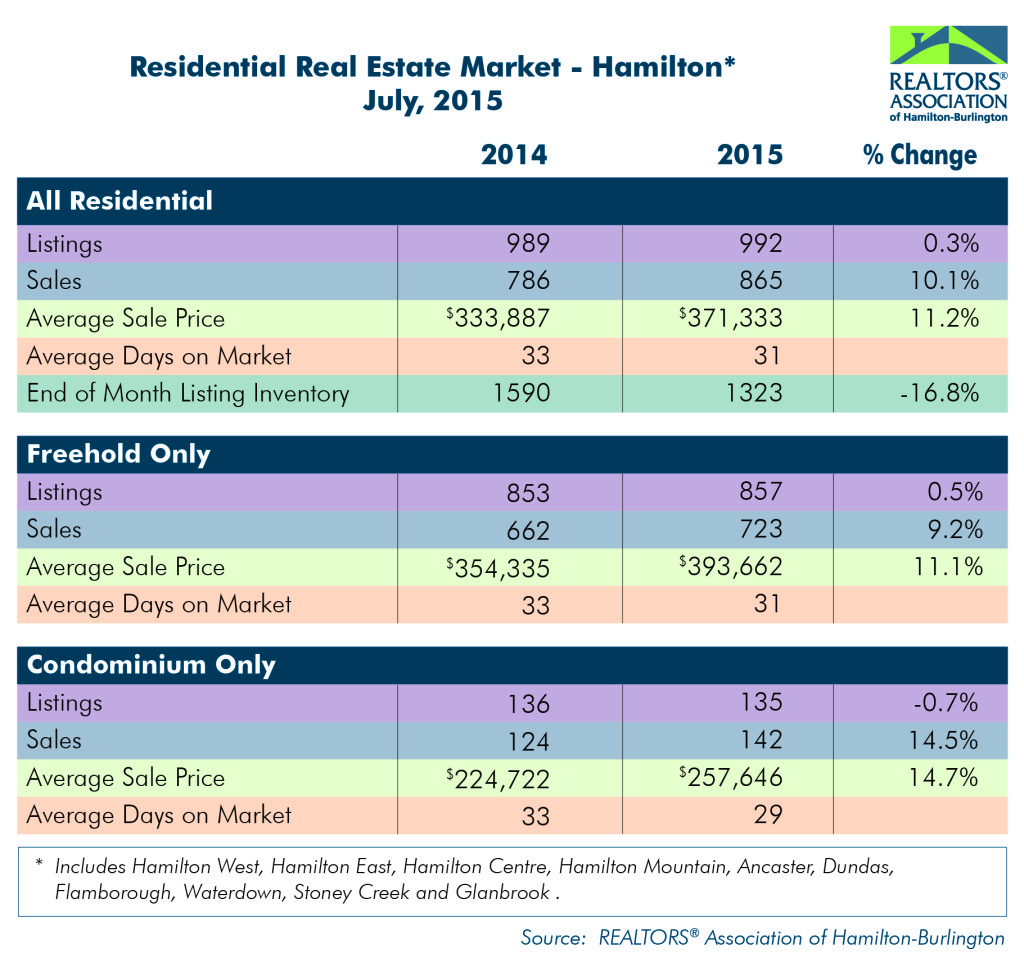
Actual overall residential sales of 1564 units were 4.8 per cent higher than the previous year at the same time. Residential freehold sales were 6.4 per cent higher than last July while sales in the condominium market decreased by 1.7 per cent.
“The sustained seller’s market is particularly evident in the condominium market,” added Godsoe. “Sales may have been down compared to last year, but so were new listings. There isn’t even a month and a half of inventory in the condo market, and the sales-to-new-listing ratio is an astounding 96 per cent in that sector.”
The average price of freehold properties showed an increase of 4.9 per cent compared to the same month the previous year; the average sale price in the condominium market increased by 7.7 per cent when compared to the same period.
The average sale price is based on the total dollar volume of all properties sold in the RAHB market area. Average sale price information can be useful in establishing long term trends, but should not be used as an indicator that specific properties have increased or decreased in value.
The average days on market decreased from 36 to 33 days in the freehold market and from 39 to 30 days in the condominium market when compared to the same month the previous year.
Year to date, sales are 12.2 per cent higher compared to the same period last year; listings are six per cent higher than last year and the average sale price is 7.8 per cent higher for the period.

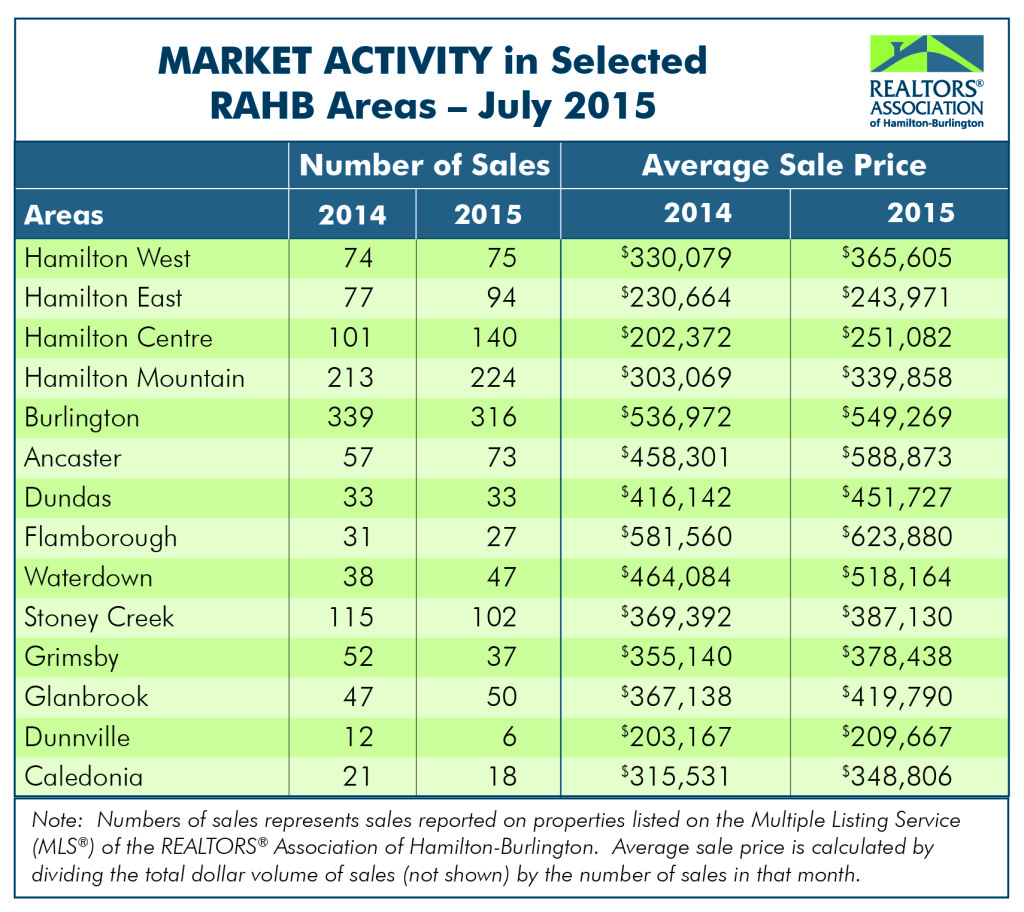
Every community in RAHB’s market area has its own localized residential market. Please refer to the accompanying chart for residential market activity in select areas in RAHB’s jurisdiction.
*Seasonal adjustment removes normal seasonal variations, enabling analysis of monthly changes and fundamental trends in the data.