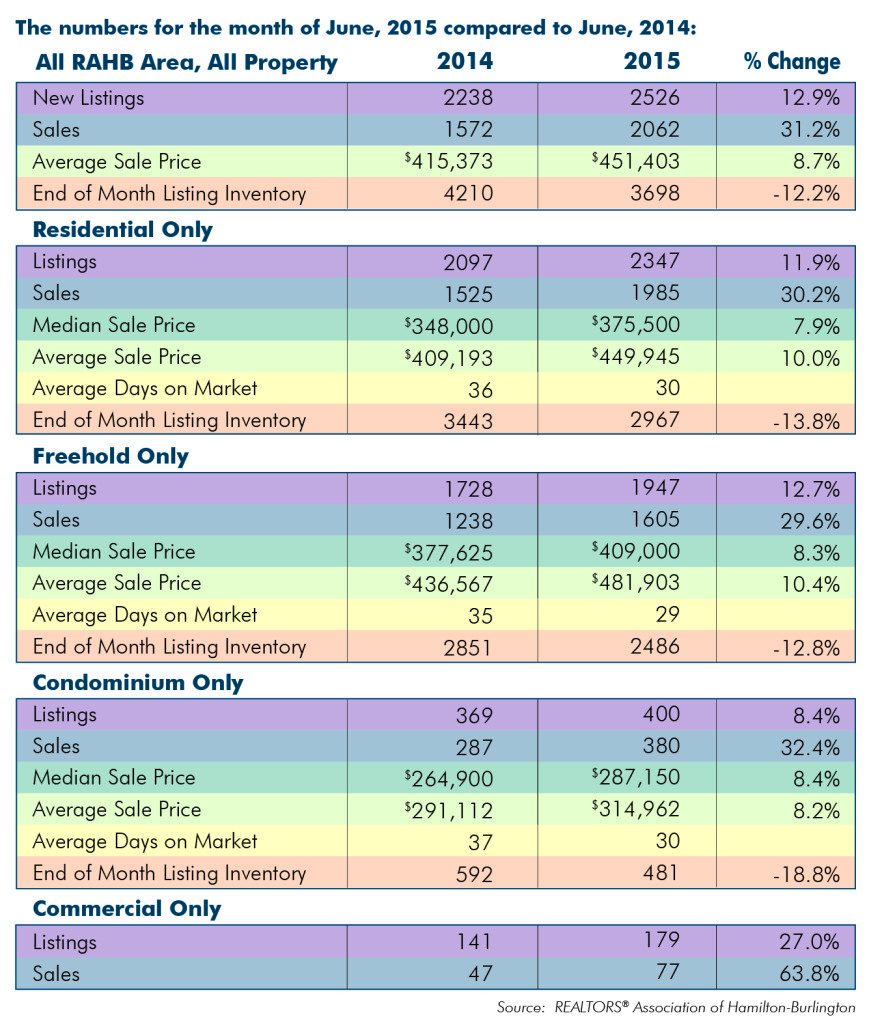
For the third month in a row, the REALTORS® Association of Hamilton-Burlington (RAHB) reported record breaking sales in the Greater Hamilton, Burlington and outlying areas. June’s 2062 property sales processed through the RAHB Multiple Listing Service® (MLS®) system smashed the record of 1810 sales set just last month.
June sales were 31.2 per cent higher compared to June of last year, and a whopping 43 per cent above the historical average for the month.
There were 2,526 properties listed in June, an increase of 12.9 per cent compared to the same month the year prior. However, the increase in sales left the end-of-month listing inventory 12.2 per cent lower than last June.
“The real estate market exploded in June,” said RAHB CEO Ross Godsoe. “To break the old record – set just last month – by that much and for the second month in a row, shows just how active it was. We saw more areas throughout Hamilton in particular where homes sold at or above list price as an average – not just in isolated cases.”
Seasonally adjusted* sales of residential properties were 22.3 per cent higher than the same month of the previous year, with the average sale price up 9.5 per cent for the month. Seasonally adjusted numbers of new listings were 6.5 per cent higher than the same month the year prior.
Seasonally adjusted data for residential properties for the month of June, 2015: 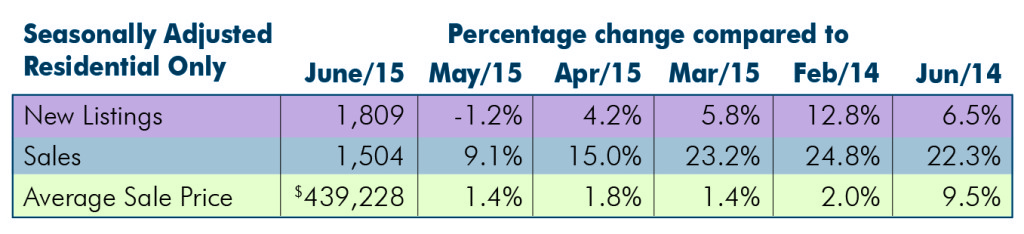
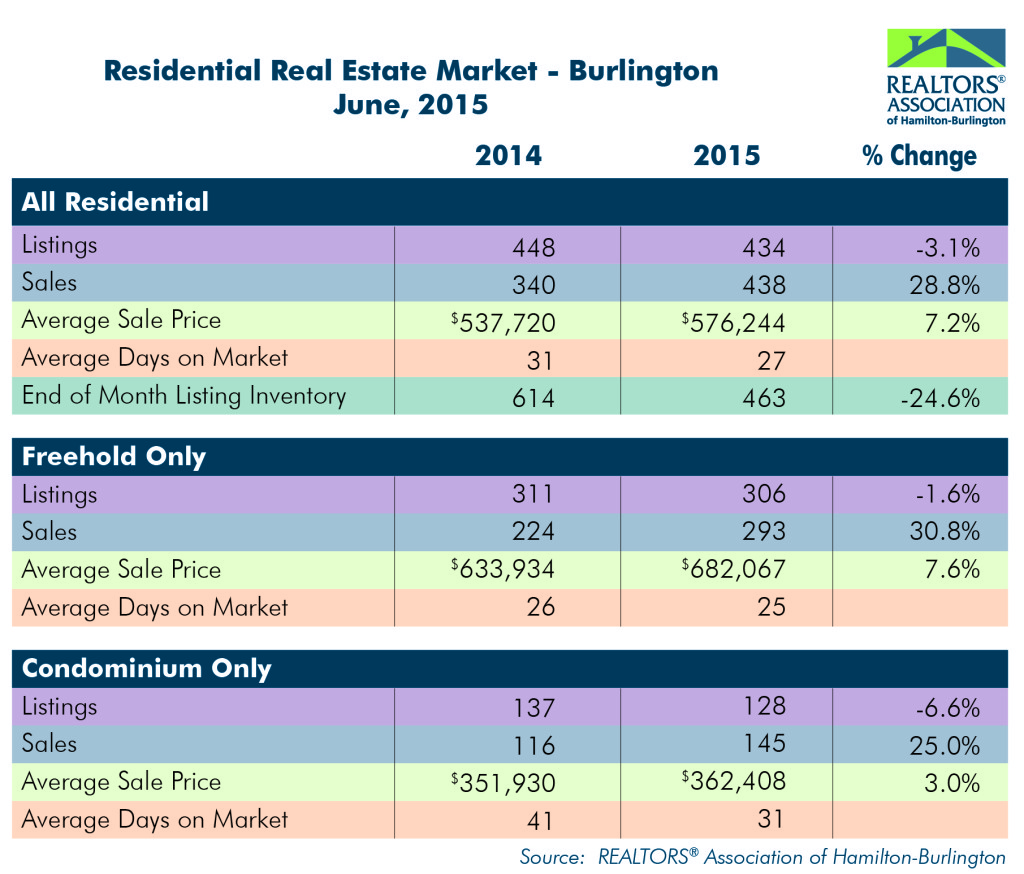
Actual overall residential sales of 1,985 units were 30.2 per cent higher than the previous year at the same time and also a new record for residential sales. Residential freehold sales were 29.6 per cent higher than last June while sales in the condominium market saw an increase of 32.4 per cent.
“Inventory is extremely low,” added Godsoe. “We are deep into a sellers’ market right now. The two main indicators are the sales-to-listing ratio, which is high at almost 85 per cent in the residential market, and months of inventory. Right now we have less than two months inventory. That is extremely low when you consider that a balanced market has five to eight months of inventory.”
The average price of freehold properties showed an increase of 10.4 per cent compared to the same month the previous year; the average sale price in the condominium market increased by 8.2 per cent when compared to the same period.
The average sale price is based on the total dollar volume of all properties sold in the RAHB market area. Average sale price information can be useful in establishing long term trends, but should not be used as an indicator that specific properties have increased or decreased in value.
The average days on market decreased from 35 to 29 days in the freehold market and from 37 to 30 days in the condominium market when compared to the same month the previous year.
Year to date, sales are 14 per cent higher compared to the same period last year; listings are 7.1 per cent higher than last year and the average sale price is 8.4 per cent higher for the period.
Every community in RAHB’s market area has its own localized residential market. Please refer to the accompanying chart for residential market activity in select areas in RAHB’s jurisdiction.
*Seasonal adjustment removes normal seasonal variations, enabling analysis of monthly changes and fundamental trends in the data.