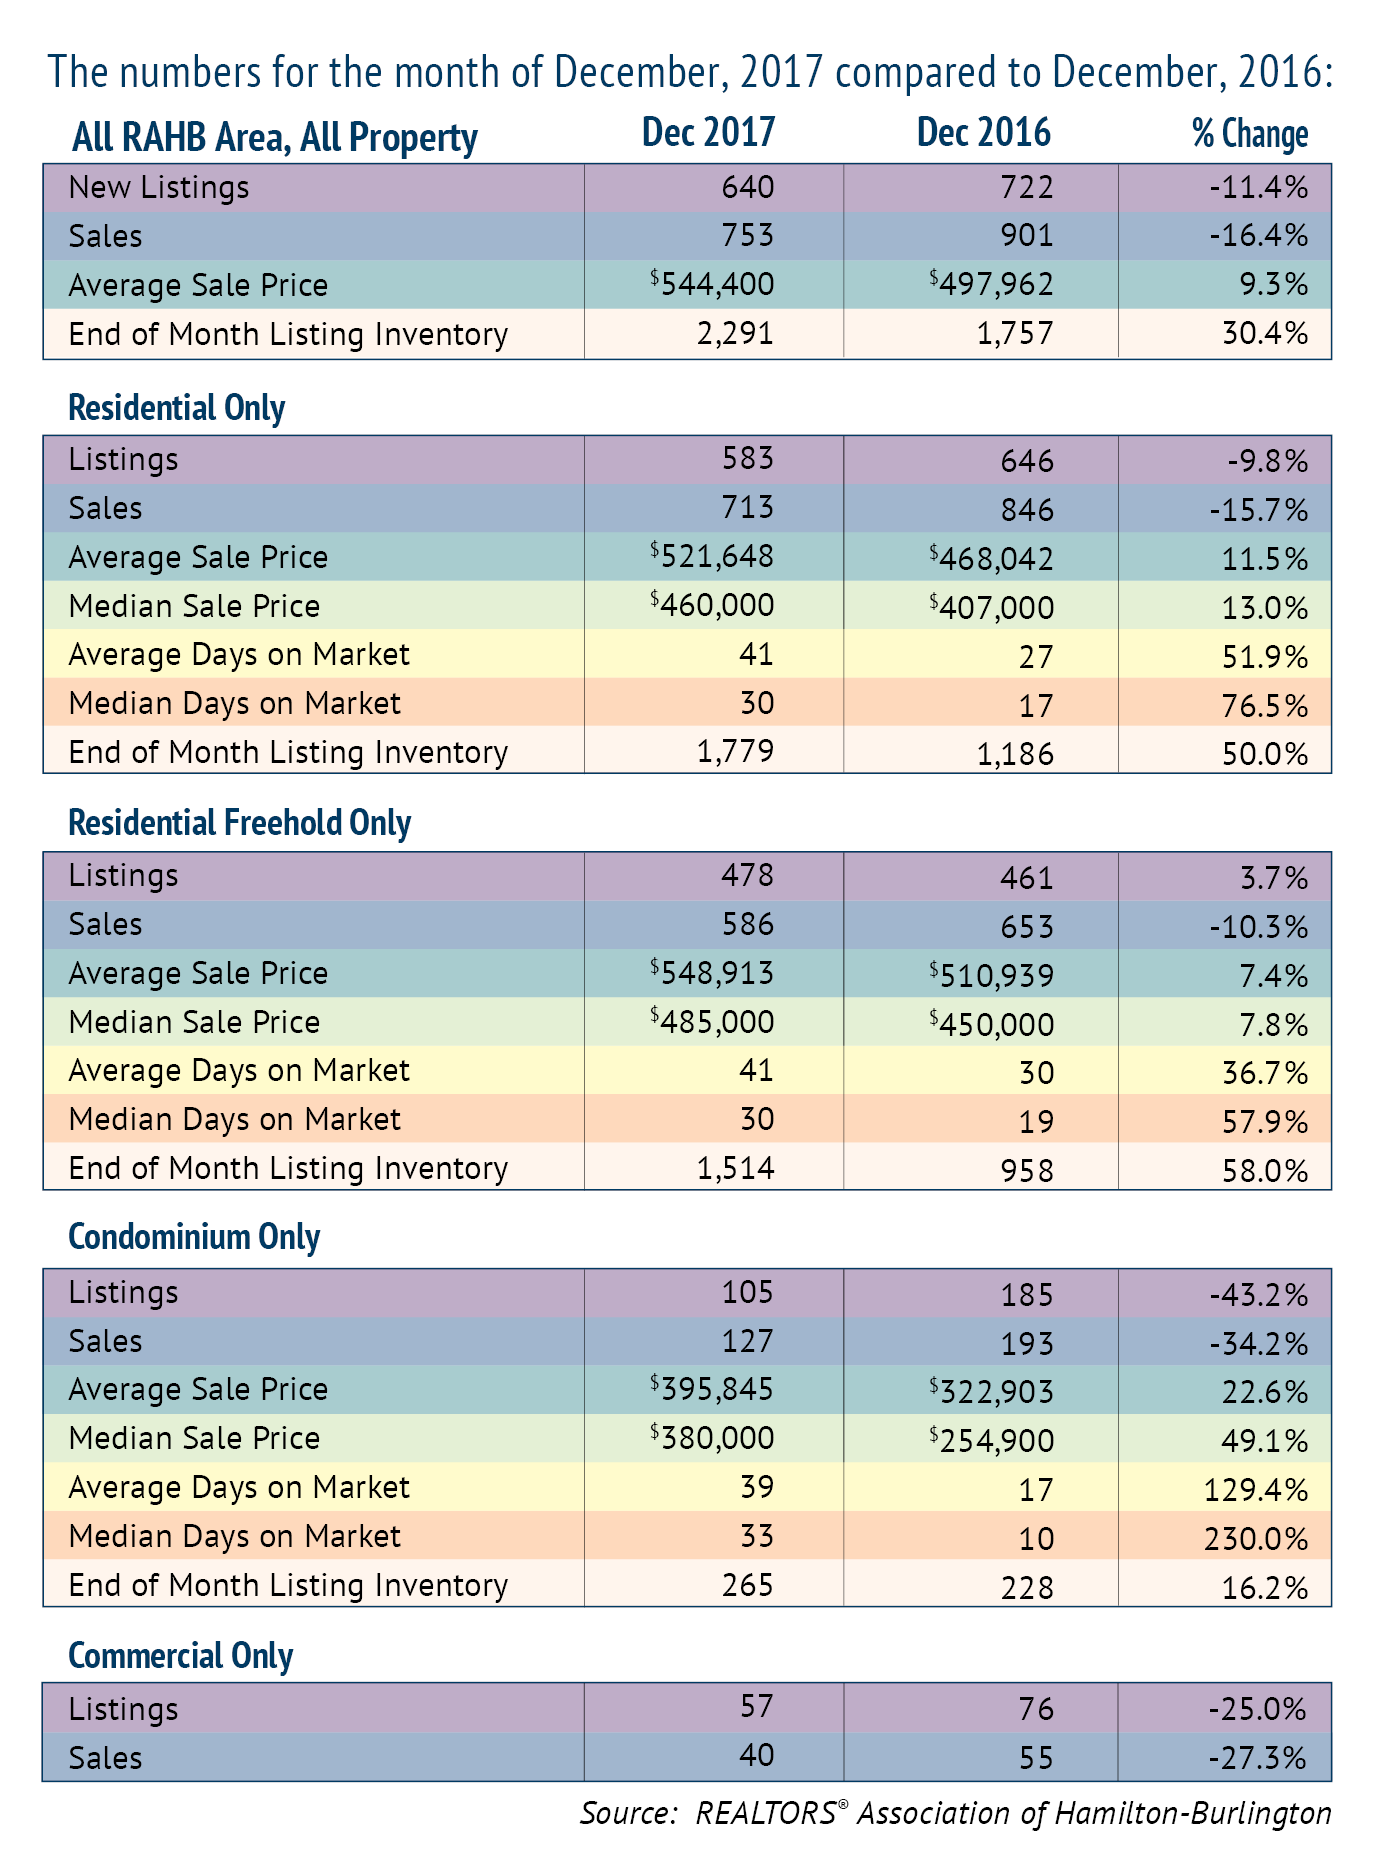
The REALTORS® Association of Hamilton-Burlington (RAHB) reported 753 sales were processed through the RAHB Multiple Listing Service® (MLS®) System in December, 16.4 per cent fewer than the same month last year but 5.2 per cent higher than the 10-year average.
All property listings were 11.4 per cent lower than the same month the previous year and 10 per cent lower than the 10-year average.
“December is traditionally the slowest month for listings and one of the slower months for sales,” said RAHB CEO George O’Neill. “Sales were actually quite good for a December – better than average and better than the comparison to the previous year might suggest. We saw record sales for the month of December in 2016, so it’s no surprise that this December’s numbers were lower.”
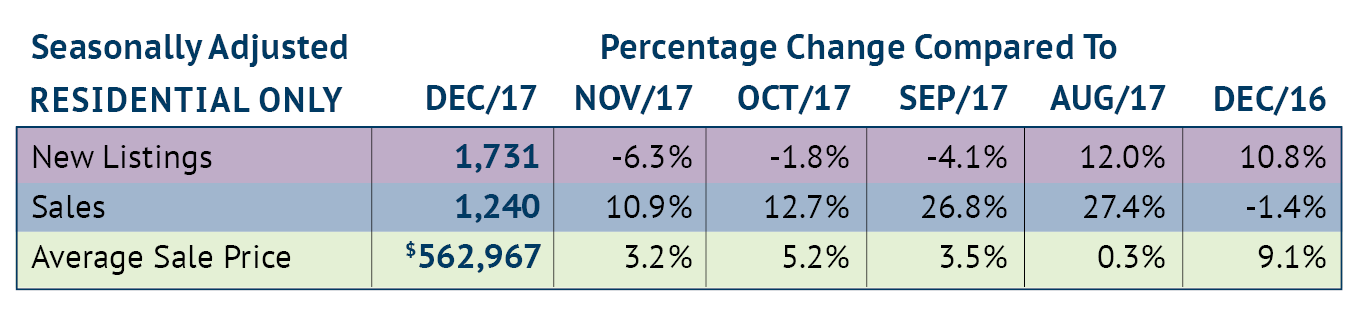
Seasonally adjusted* sales of residential properties were 1.4 per cent lower than the same month last year, with the average sale price up 9.1 per cent for the month. Seasonally adjusted numbers of new listings were 10.8 per cent higher than December of 2016.
Overall residential sales of 713 units were 15.7 per cent lower than December of the previous year. Residential freehold sales were 10.3 per cent lower than December, 2016 while sales in the condominium market were 34.2 per cent lower.
The median price of freehold properties increased by 7.8 per cent over the same month of the previous year while the median price for condominium properties increased by 49.1 per cent compared to the same period.
The average price of freehold properties showed an increase of 7.4 per cent compared to December of 2016; the average sale price in the condominium market increased by 22.6 per cent compared to the same period.
Average sale price is based on the total dollar volume of all properties sold through the RAHB MLS® System. Average sale price can be useful in establishing long-term trends, but should not be used as an indicator that specific properties have increased or decreased in value. Contact a REALTOR® for information about your area or property.
“Prices continue to increase compared to the previous year, even though, from month to month, they have followed a pattern of coming down from the high of the spring market,” says O’Neill.
The average number of days on market increased to 41 days from 30 days in the freehold market and increased to 39 days from 17 days in the condominium market, compared to December of the previous year.
“With the increase in the average days on market, buyers should find they have more time to view and compare properties,” noted O’Neill. “We always advise buyers and sellers to use the services of a REALTOR® for their home purchase or sale because REALTORS® are knowledgeable in changing markets. Real estate is always local, and a REALTOR® can provide insights about various neighbourhoods that aren’t necessarily evident from statistics.”
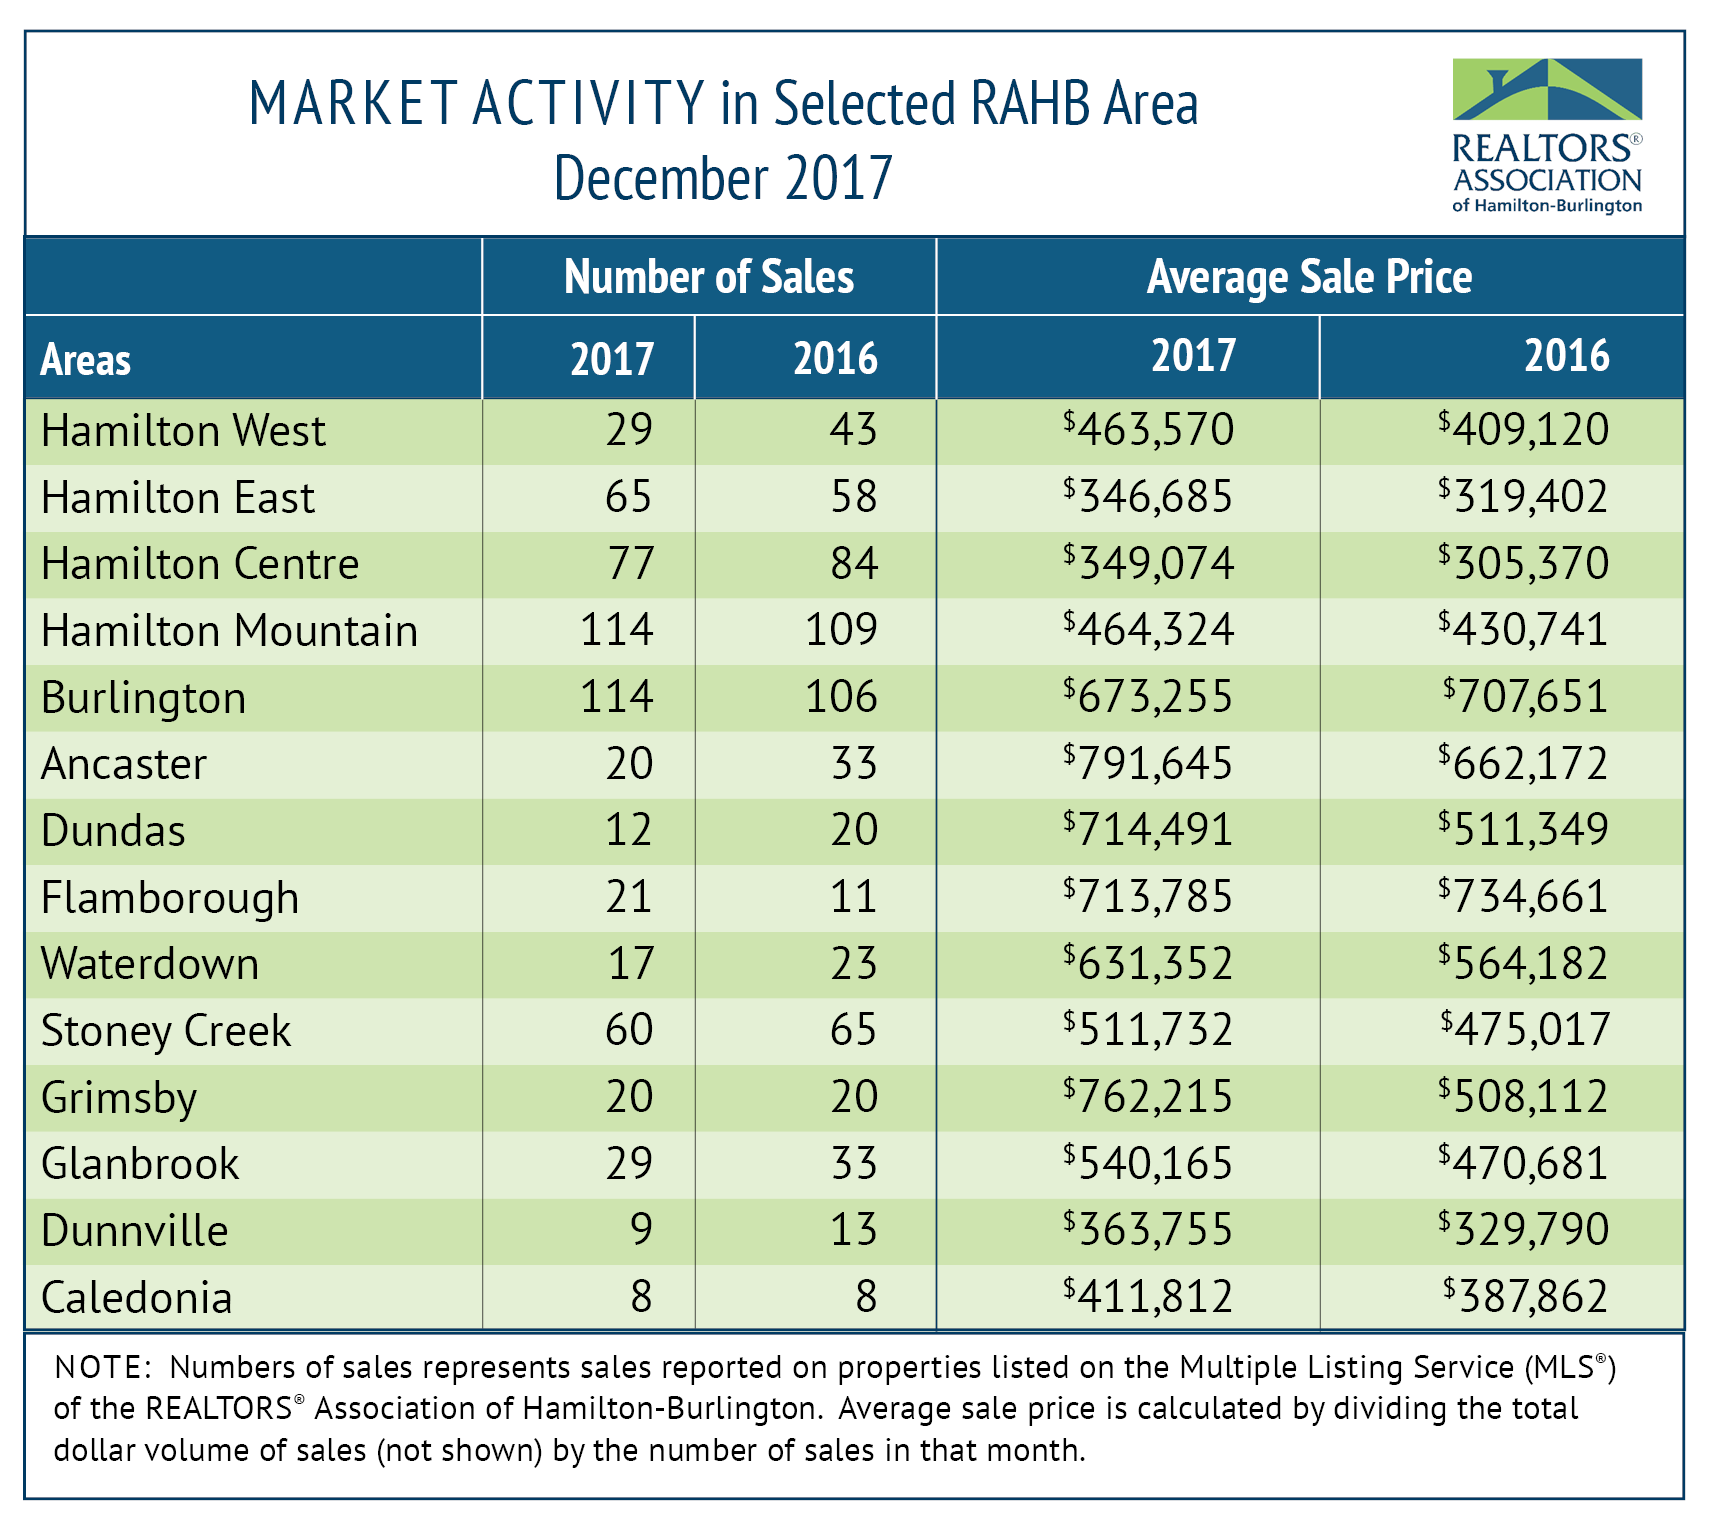
Every community in RAHB’s market area has its own localized market. Refer to the accompanying chart, and please ensure you contact a local REALTOR® for professional advice.
*Seasonal adjustment removes normal seasonal variations, enabling analysis of monthly changes and fundamental trends in the data.
December 2017 Stats Breakdown: