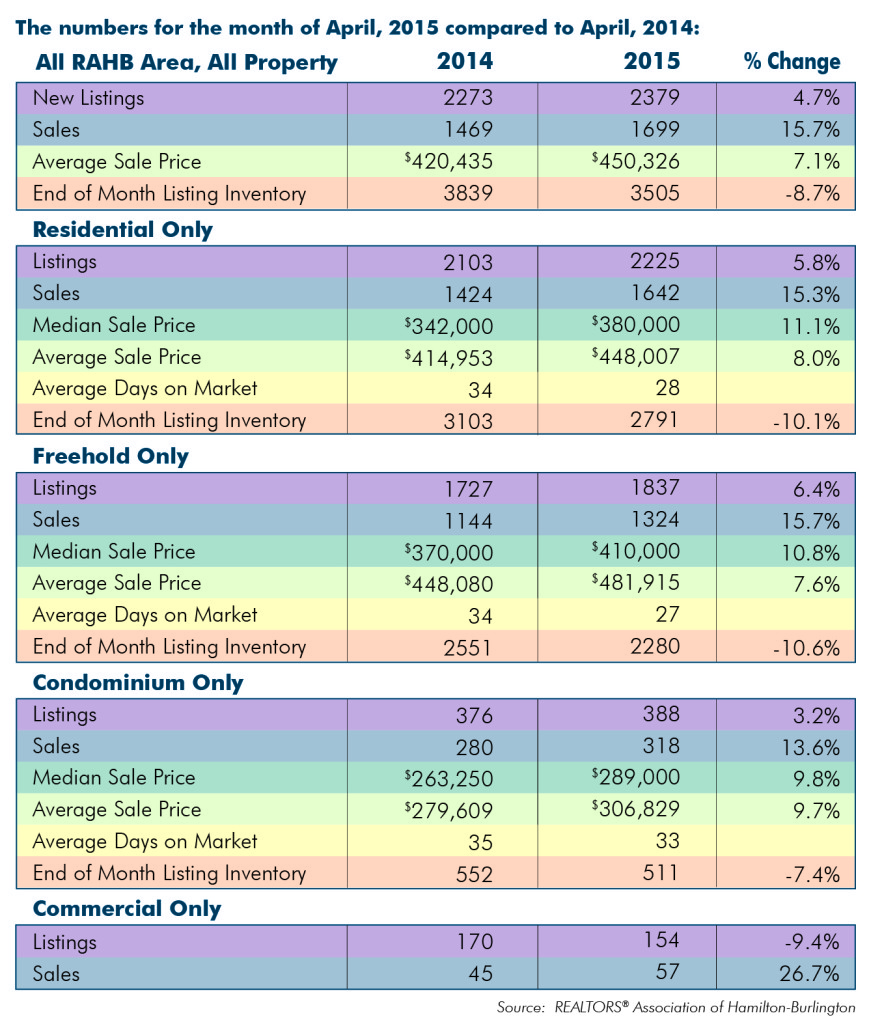
The REALTORS® Association of Hamilton-Burlington (RAHB) reported a record 1,699 property sales processed through the RAHB Multiple Listing Service® (MLS®) system in April. This represents a 15.7 per cent increase in sales compared to April of last year, and smashes the old record of 1,660 all property sales set in May of 2014.
There were 2,379 properties listed in April, an increase of 15.7 per cent compared to the same month the year prior. End-of-month listing inventory was 8.7 per cent lower than last April.
“The Greater Hamilton-Burlington real estate market has never seen this kind of activity,” said RAHB CEO Ross Godsoe. “There are a number of areas in Hamilton, Burlington and even outlying communities where, on average, properties are being sold for full list price or higher. It’s rare to see that kind activity as an average for an area.”
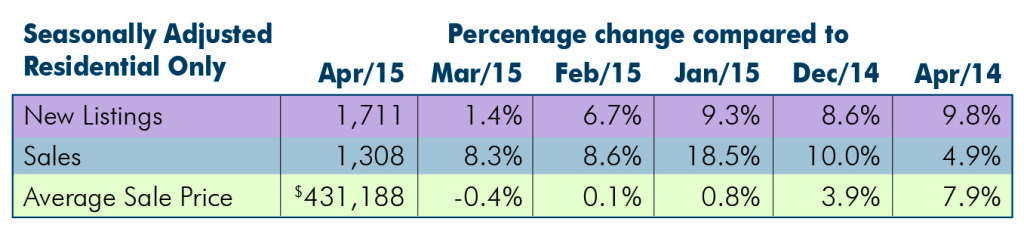
Seasonally adjusted* sales of residential properties were 13.8 per cent higher than the same month of the previous year, with the average sale price up 7.9 per cent for the month. Seasonally adjusted numbers of new listings were 4.3 per cent higher than the same month the year prior.
Seasonally adjusted data for residential properties for the month of April, 2015:
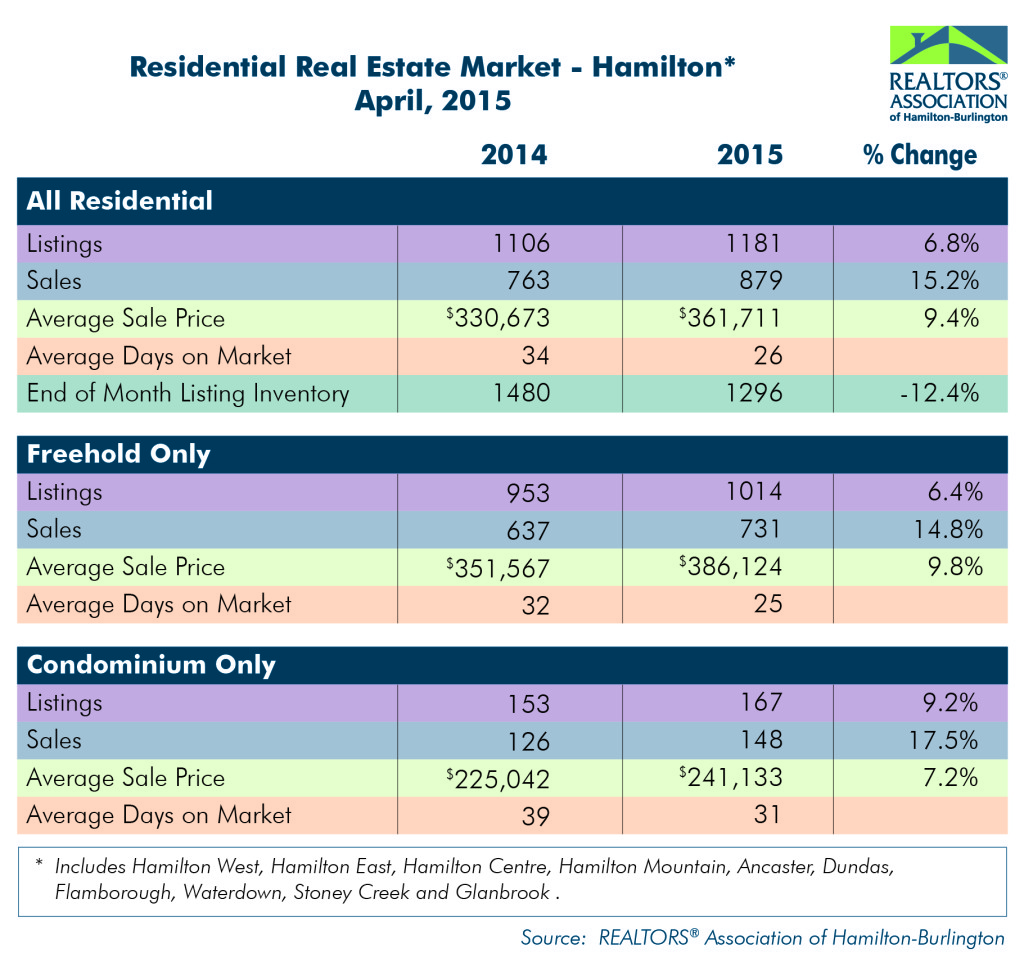
Actual overall residential sales of 1,642 units were 15.3 per cent higher than the previous year at the same time and also a new record for residential sales. Residential freehold sales were 15.7 per cent higher than last April while sales in the condominium market saw an increase of 13.6 per cent.
“Listings and sales in the residential market are well over average for the month,” added Godsoe. “Despite the increase in listings, end of month inventory is still considered low, at just over two months of inventory. That, coupled with a high sales to listing ratio, confirms we are still firmly in a seller’s market.”
The average price of freehold properties showed an increase of 7.6 per cent compared to the same month the previous year; the average sale price in the condominium market increased by 9.7 per cent when compared to the same period.
The average sale price is based on the total dollar volume of all properties sold in the RAHB market area. Average sale price information can be useful in establishing long term trends, but should not be used as an indicator that specific properties have increased or decreased in value.
The average days on market decreased from 34 to 27 days in the freehold market and from 35 to 33 days in the condominium market when compared to the same month the previous year.
Year to date, sales are 9.7 per cent higher compared to the same quarter last year; listings are 5.6 per cent higher than last year and the average sale price is 8.5 per cent higher for the period.
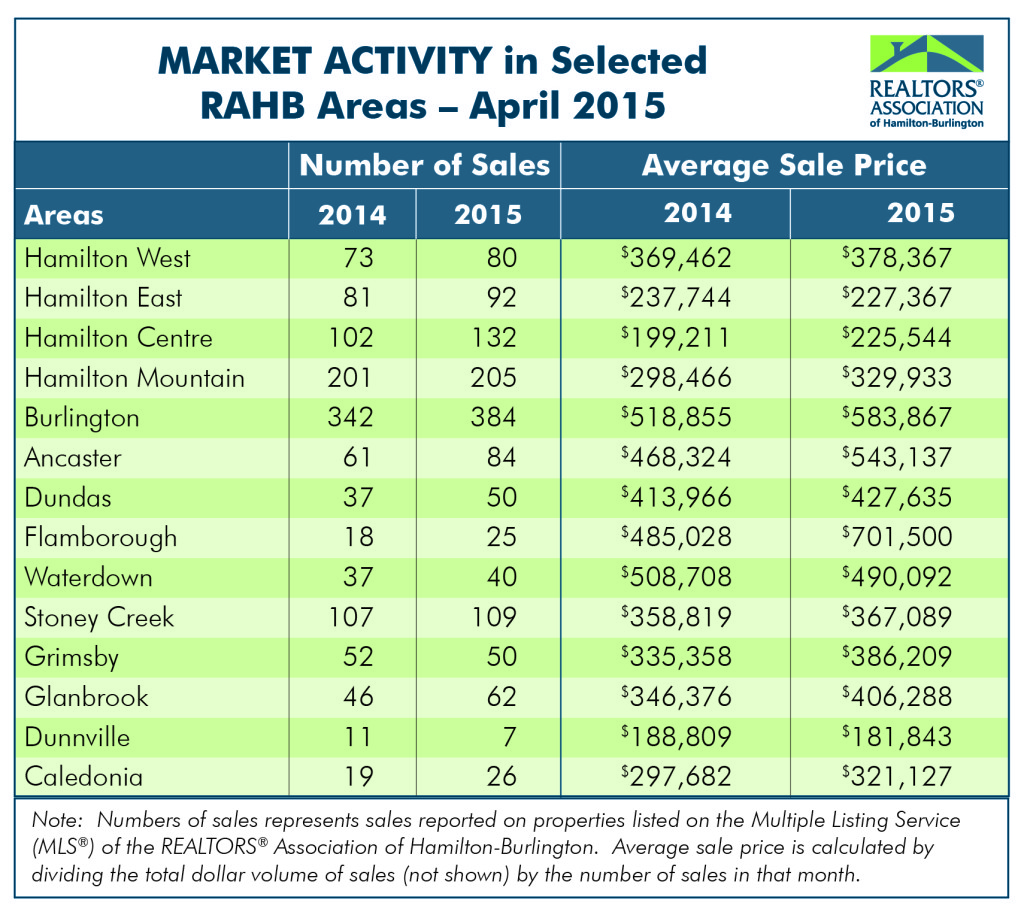
Every community in RAHB’s market area has its own localized residential market. Please refer to the accompanying chart for residential market activity in select areas in RAHB’s jurisdiction.
*Seasonal adjustment removes normal seasonal variations, enabling analysis of monthly changes and fundamental trends in the data.