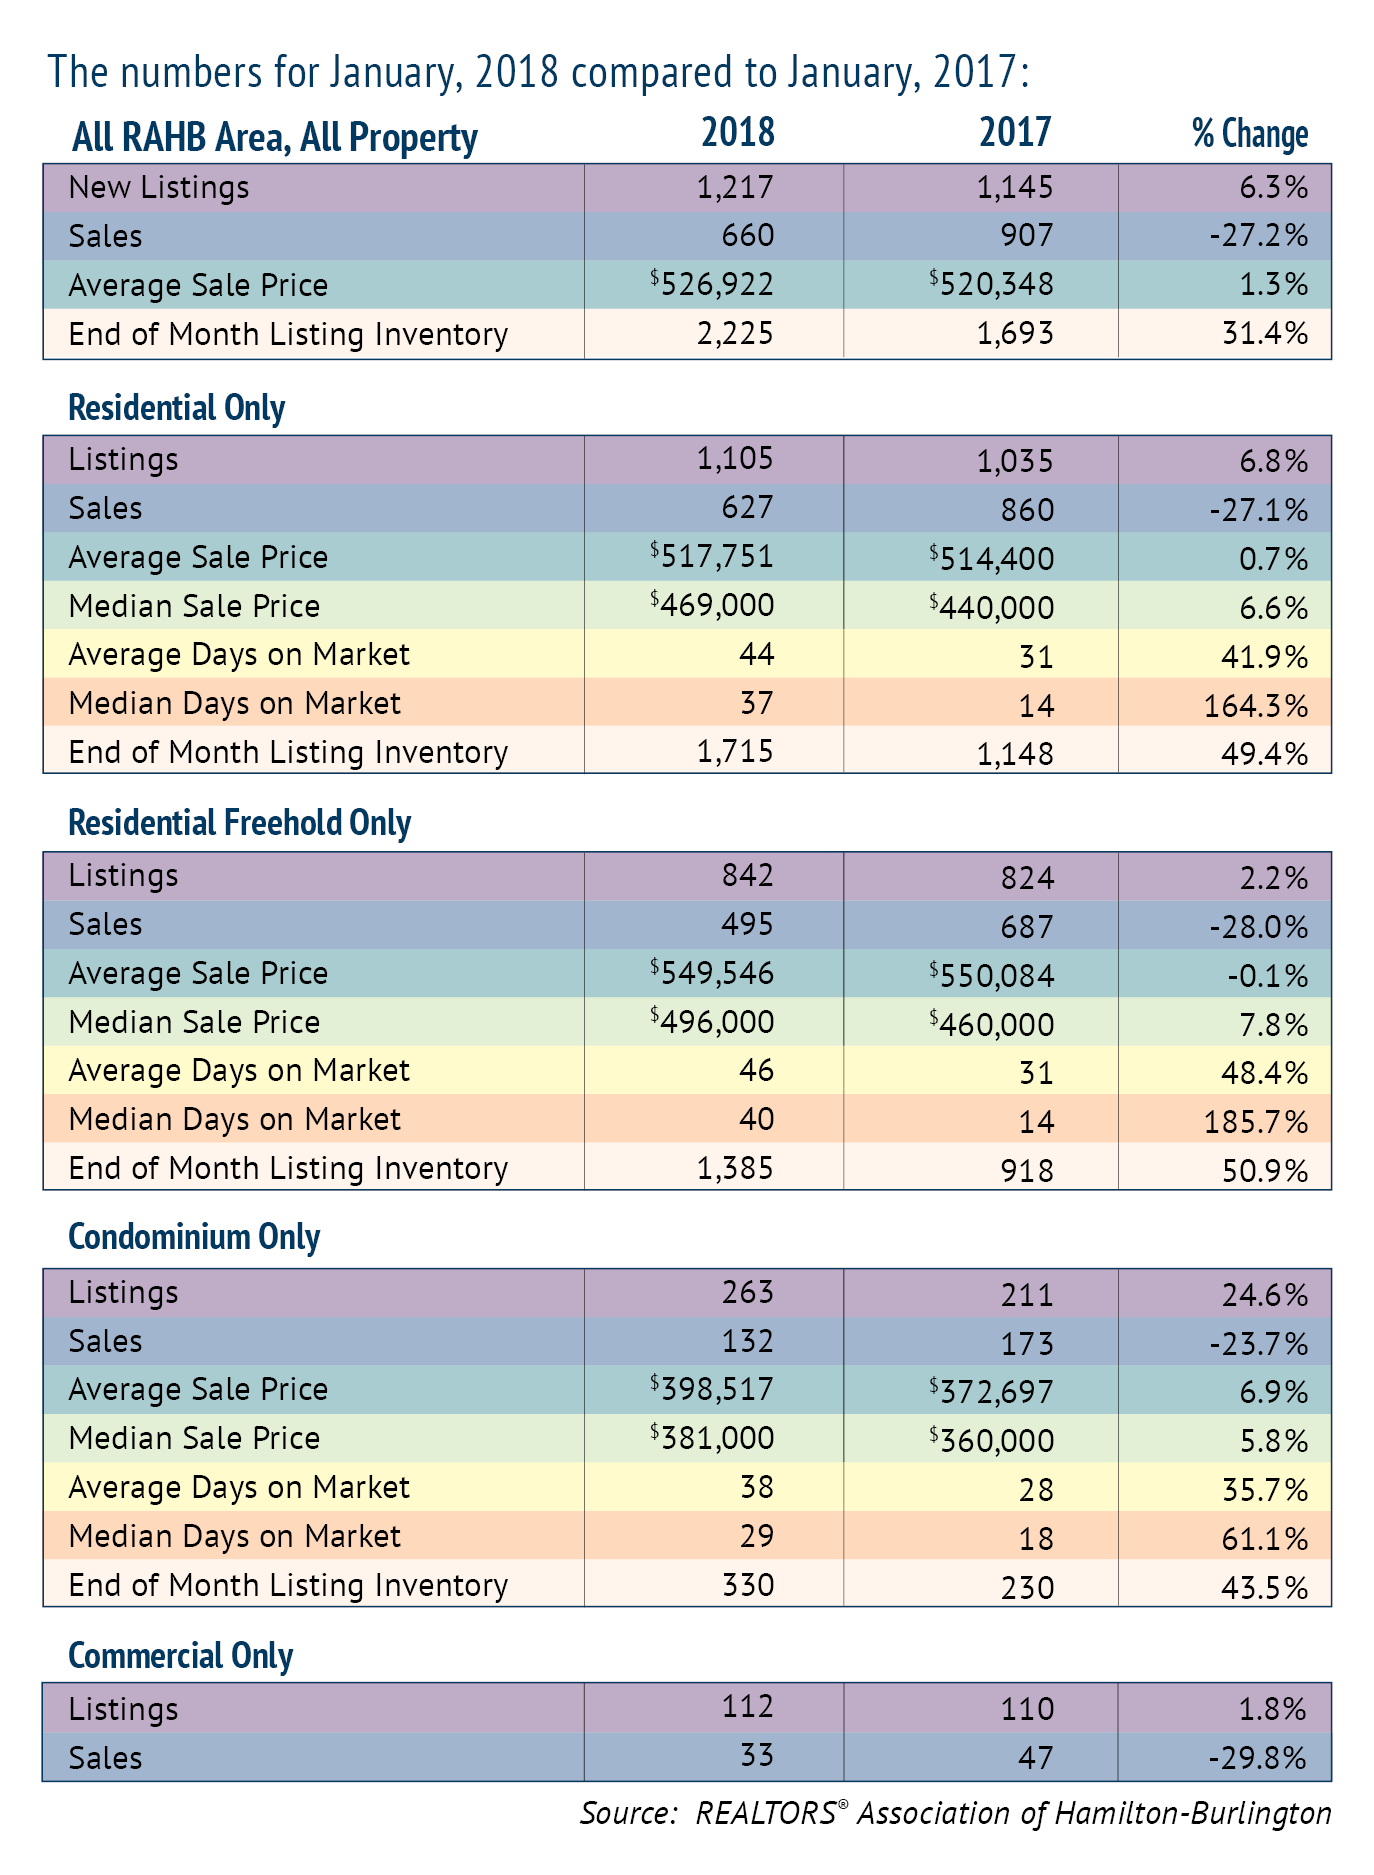
The REALTORS® Association of Hamilton-Burlington (RAHB) reported 660 sales were processed through the RAHB Multiple Listing Service® (MLS®) System in January, 27.2 per cent fewer than the same month last year and 12.5 per cent lower than the 10-year average for the month.
All property listings were 6.3 per cent higher than the same month last year and 22.3 per cent lower than the 10-year average.
“We definitely saw a real estate market hit by the winter chill,” said RAHB CEO George O’Neill. “Both listings and sales were considerably lower than the 10-year average for the month of January. Even so, with more listings at the end of the month than last year, we have a more balanced market, with a sales-to-new listings ratio of 56.7 per cent and over three months of listing inventory for the residential market.”
Seasonally adjusted* sales of residential properties were 30.6 per cent lower than the same month last year, with the average sale price up 4.2 per cent for the month. Seasonally adjusted numbers of new listings were 6.7 per cent higher than January of 2017.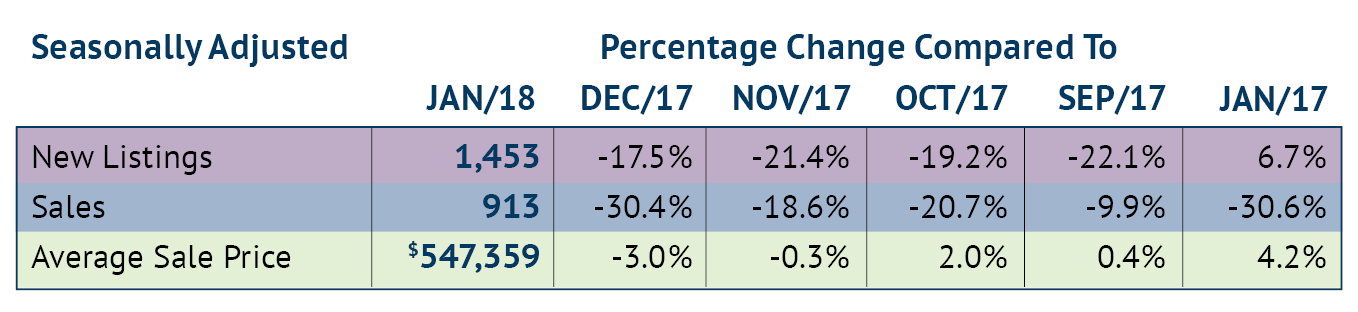
Overall residential sales of 627 units were 27.1 per cent lower than January last year. Residential freehold sales were 28 per cent lower than the same month last year while sales in the condominium market were 23.7 per cent lower.
The median price of freehold properties increased by 7.8 per cent over the same month of the previous year while the median price for condominium properties increased by 5.8 per cent compared to the same period.
The average price of freehold properties was virtually the same as in January 2017; the average sale price in the condominium market increased by 6.9 per cent compared to the same period.
Average sale price is based on the total dollar volume of all properties sold through the RAHB MLS® System. Average sale price can be useful in establishing long-term trends, but should not be used as an indicator that specific properties have increased or decreased in value. Contact a REALTOR® for information about your area or property.
“The most dramatic changes from last year to this are the number of days on market and the end of month listing inventory,” said O’Neill. “Last year we had few properties available so they were being snapped up quickly, while this year, with more listings on the market, buyers generally have more time to comparison shop.”
The average number of days on market increased to 46 days from 31 days in the freehold market and increased to 38 days from 28 days in the condominium market, compared to the same month last year.
“While it is hard to know for sure, the new mortgage stress test that became effective January 1, 2018 may have affected sales for the month,” noted O’Neill. “After an initial drop in sales after the April announcement of the Ontario Fair Housing Plan, sales were higher than the 10-year average again for the last three months of last year. Now, after the second government policy has come into effect, sales have dropped off once more. Whether this is a lasting pattern is still to be seen.”
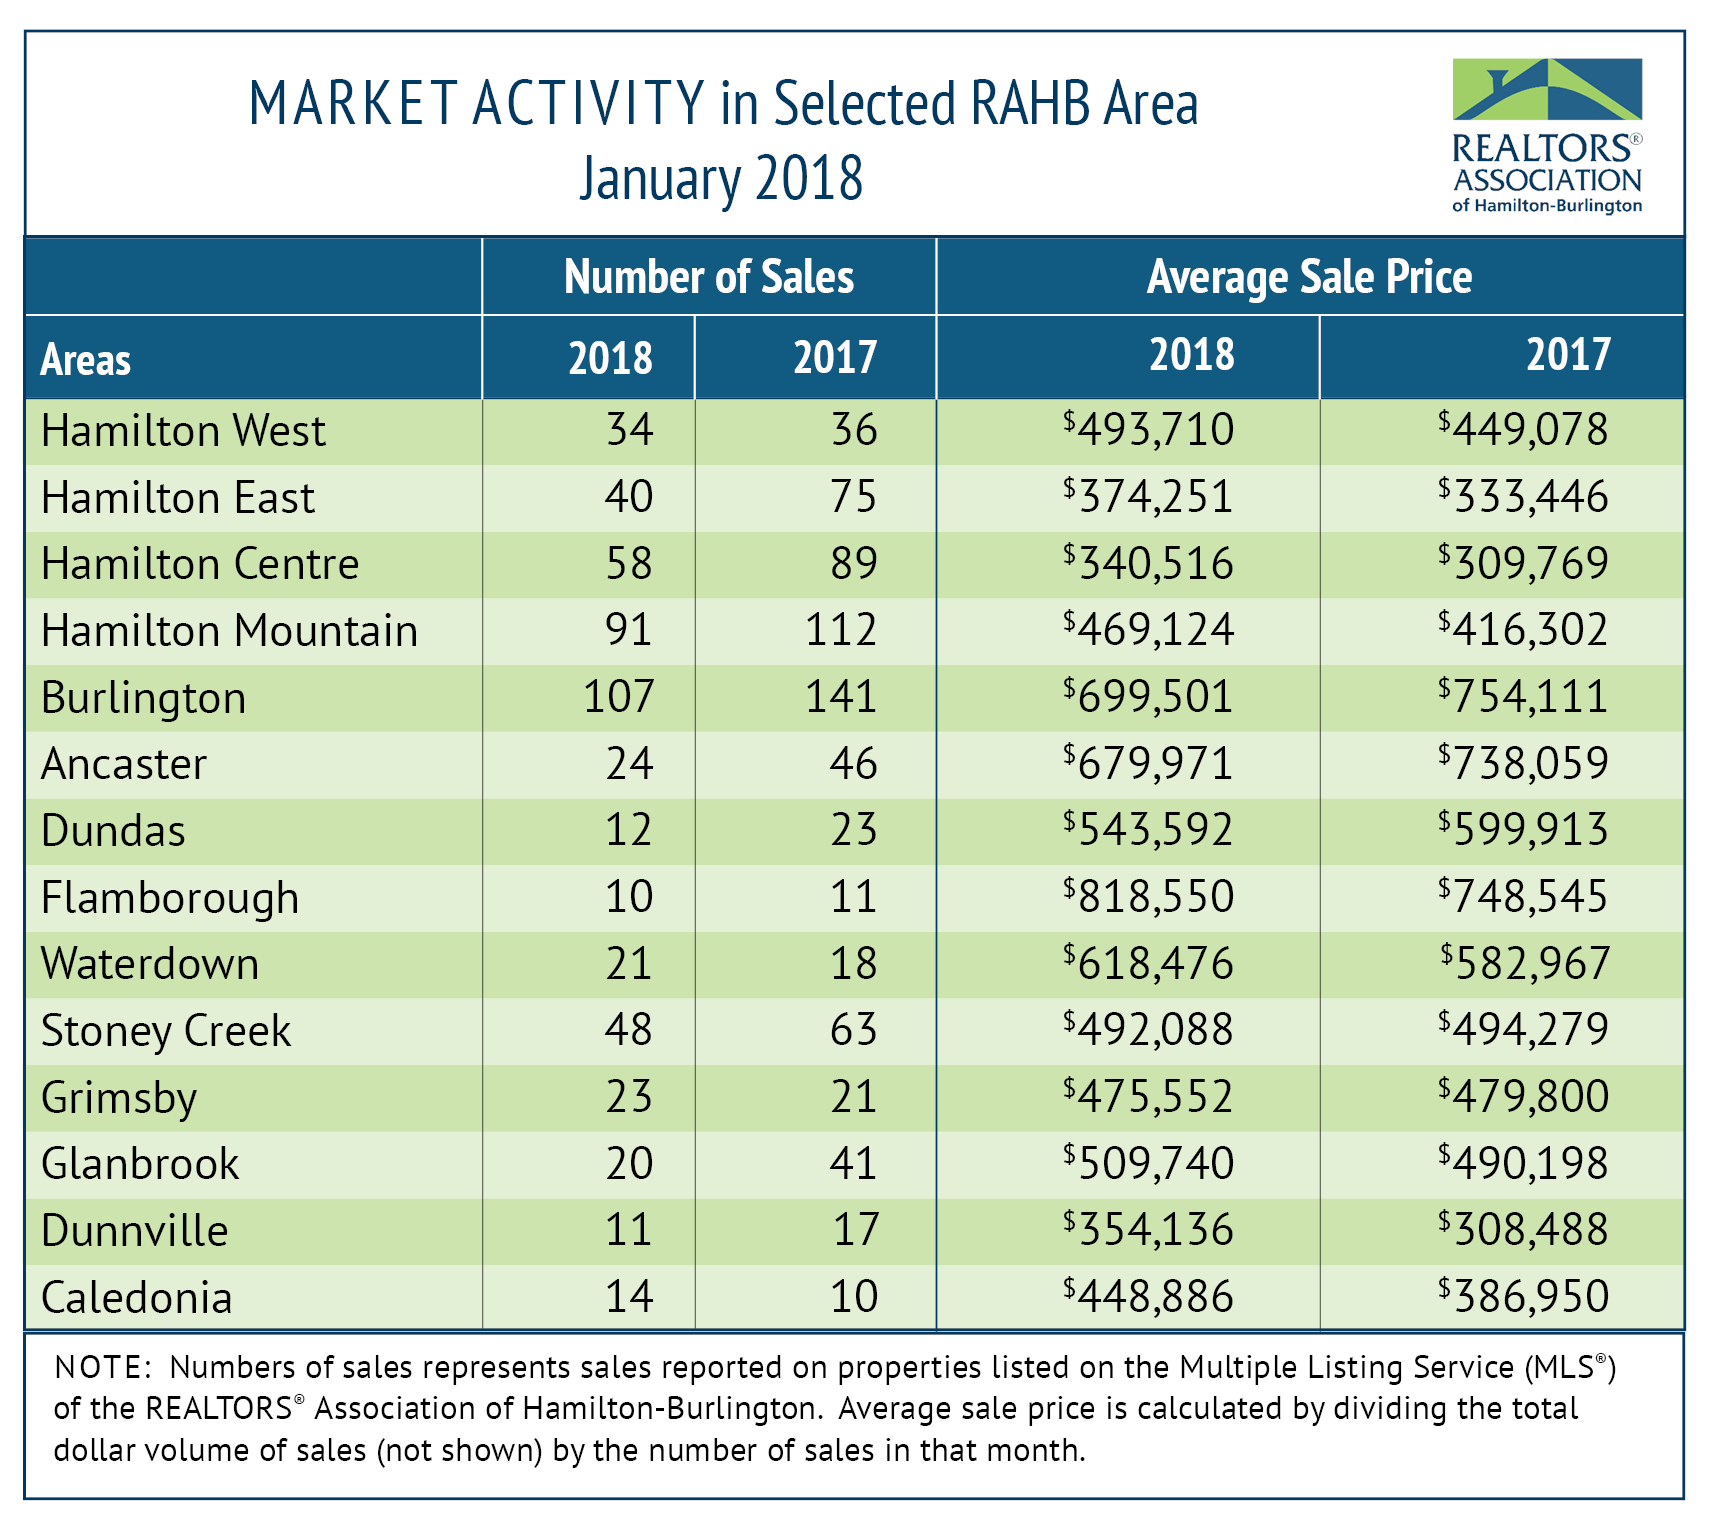
Every community in RAHB’s market area has its own localized market. Refer to the accompanying chart, and please ensure you contact a local REALTOR® for professional advice.
*Seasonal adjustment removes normal seasonal variations, enabling analysis of monthly changes and fundamental trends in the data.
Monthly Sales Statistics Breakdown: