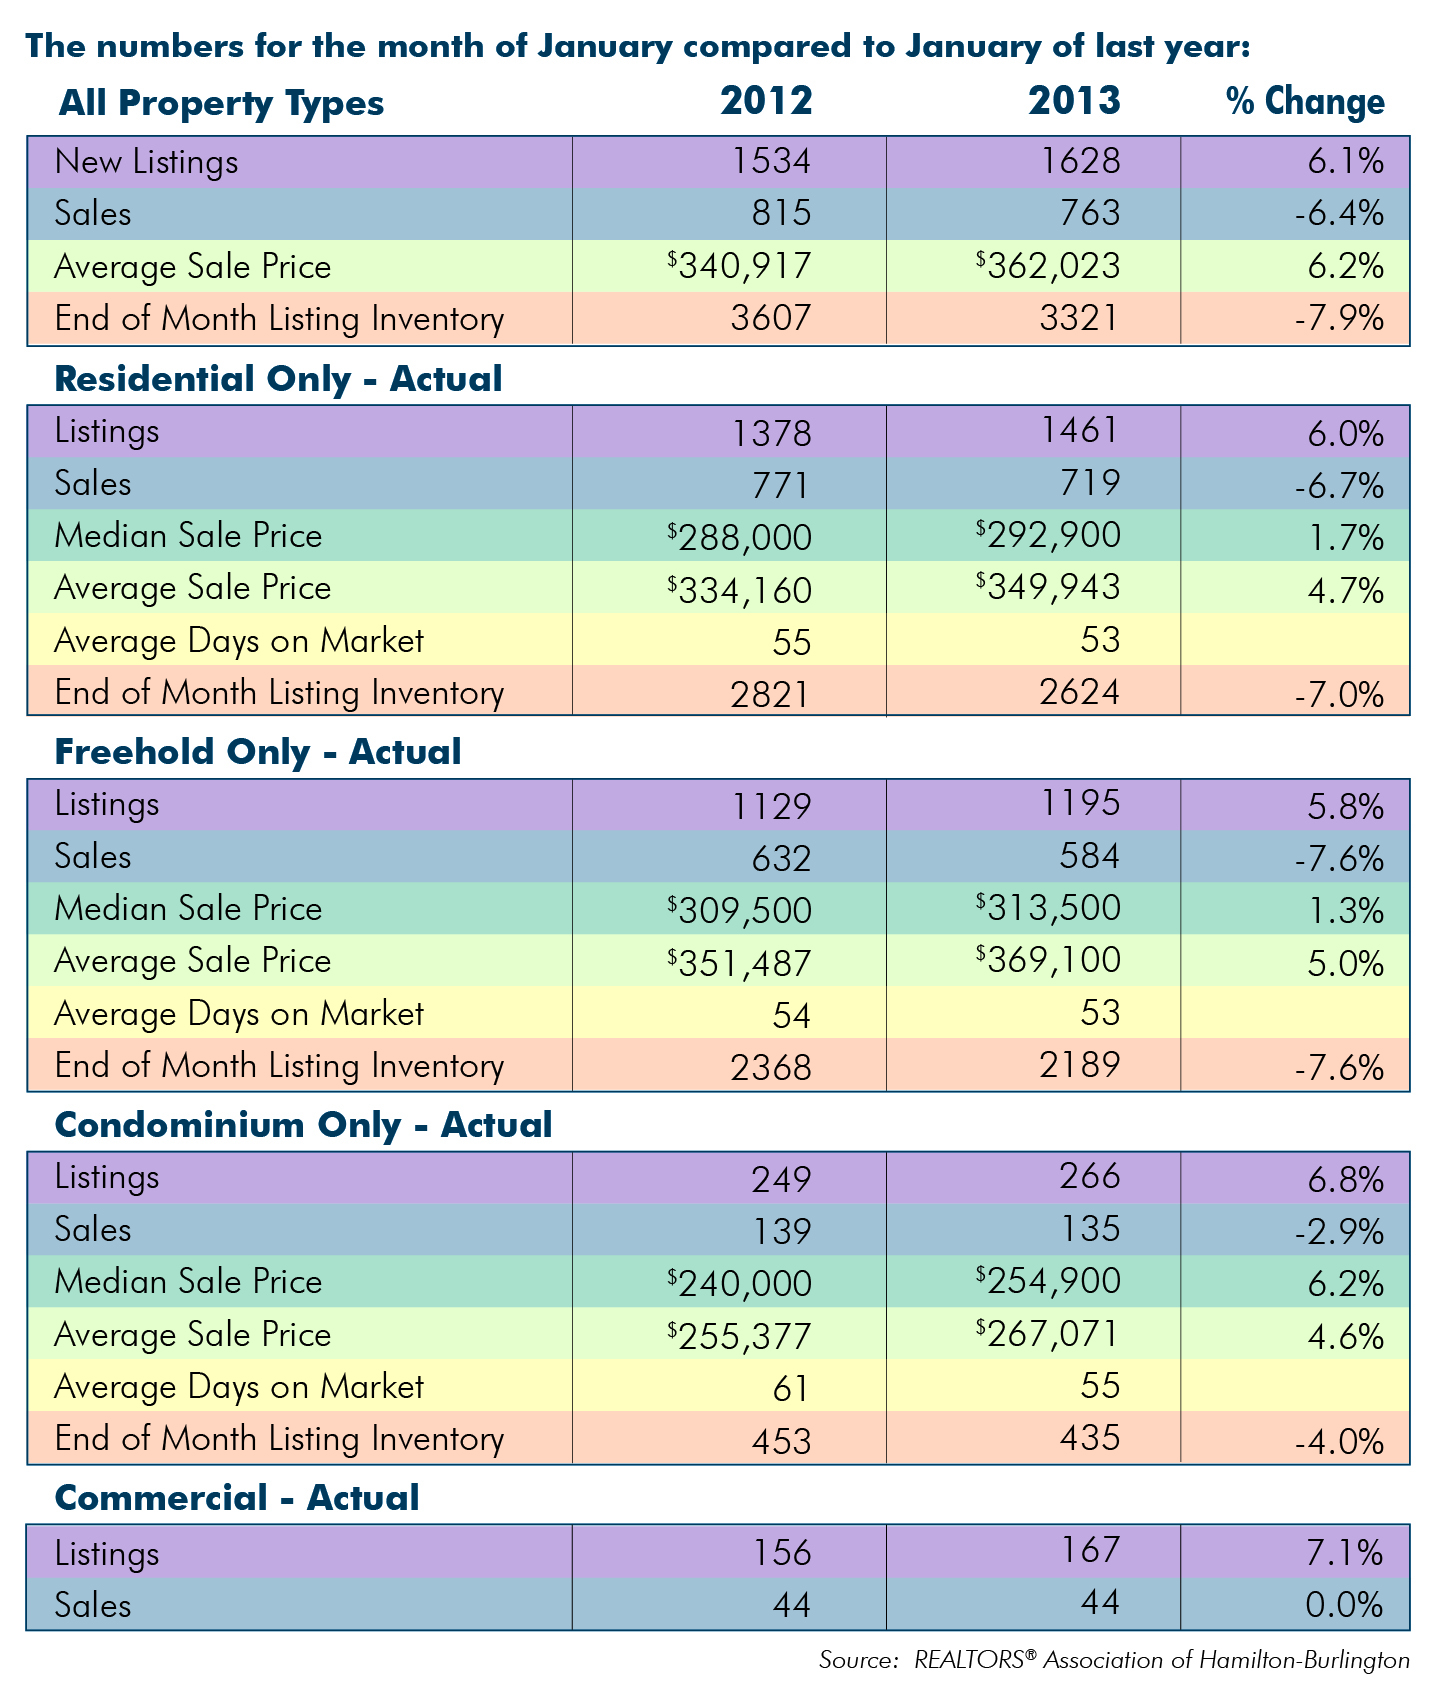
The REALTORS® Association of Hamilton-Burlington (RAHB) reported 763 property sales through the RAHB Multiple Listing Service® (MLS®) for the month of January, representing a 6.4 per cent decrease in sales over the same month last year. RAHB also reported a 6.1 per cent increase in listings compared to the same month last year. The average sale price for all property types was up over January of last year by 6.2 per cent.
“Our sales in January seem to be low because we are comparing them to last year,” said RAHB CEO Ross Godsoe. “but they really are right on average for the month.”
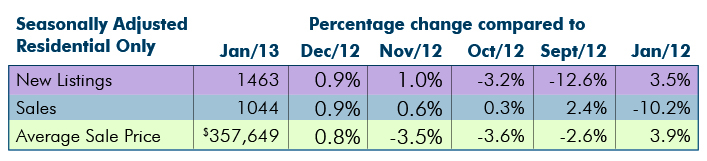
Seasonally adjusted* sales of residential properties were 10.2 per cent lower than the same month last year, with the average sale price up 3.9 per cent for the month. Seasonally adjusted numbers of new listings were 3.5 per cent higher than the same month last year.
Seasonally adjusted data for residential properties for the month of January, 2013:
Actual overall residential sales were 6.7 per cent lower than the previous year at the same time. Residential freehold sales were 7.6 per cent lower than last year; the condominium market saw a decline in sales of only 2.9 per cent. The average sale price of freehold properties showed an increase of five per cent over the same month last year, while the condominium market saw an increase of 4.6 per cent when compared to the same period last year.
The average sale price is based on the total dollar volume of all residential properties sold. Average sale price information can be useful in establishing long term trends, but should not be used as an indicator that specific properties have increased or decreased in value.
The average days on market dropped from 54 days to 53 days in the freehold market and from 61 days to 55 for condominiums.
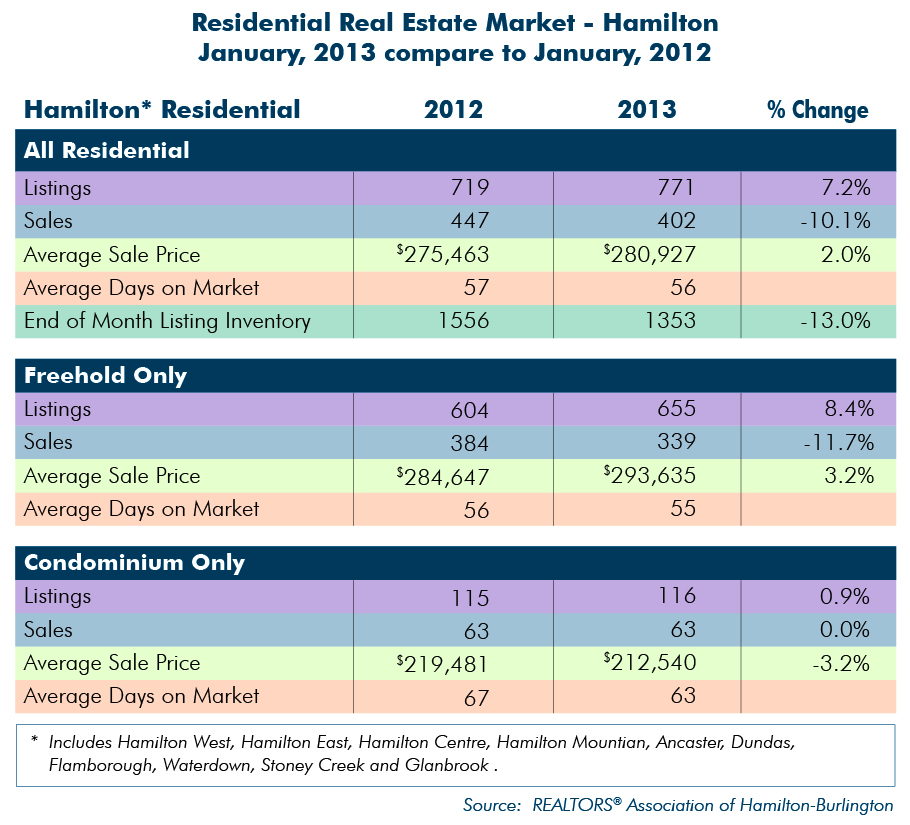
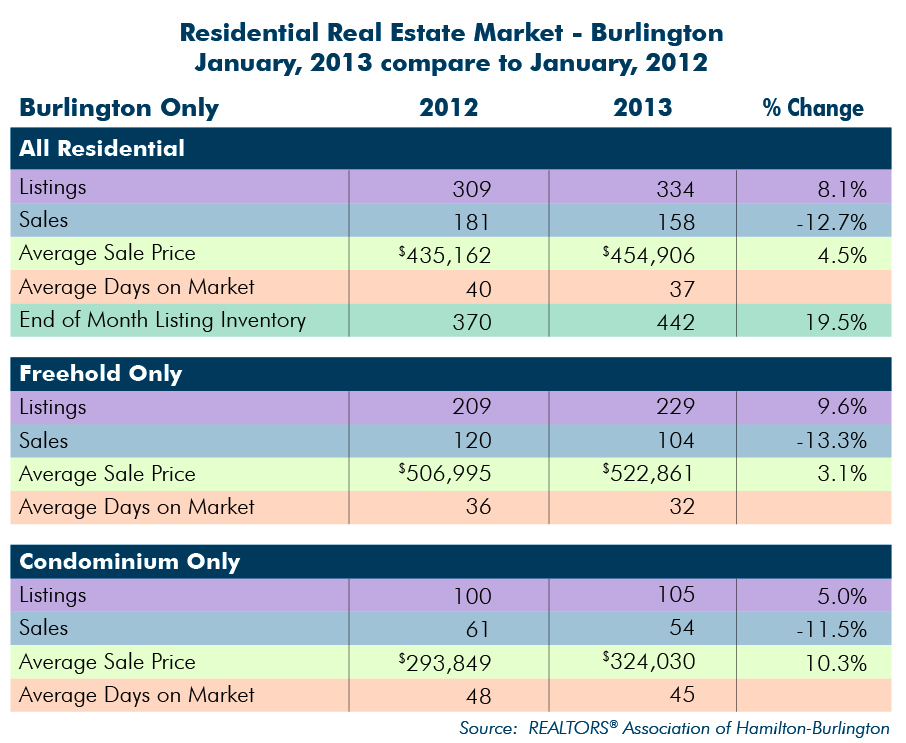
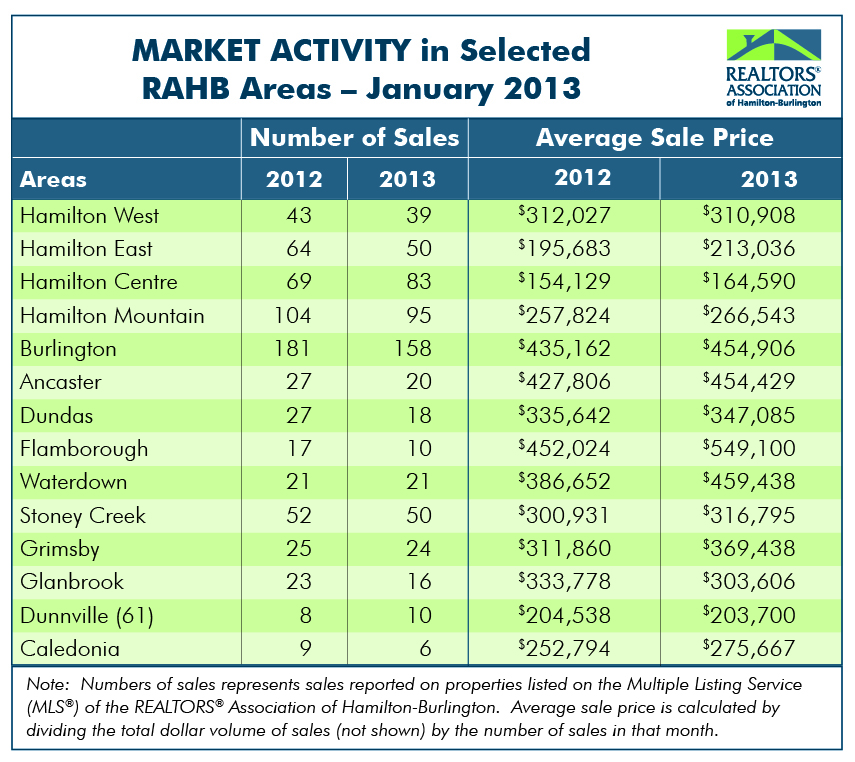
“There are big differences in how the real estate market performed in various communities”, added Godsoe. “For instance, Burlington has an almost 20 per cent increase in inventory over last January, where Hamilton has a 13 per cent decrease. Looking at the numbers gives the big picture of what’s happening in the overall RAHB market area, but buyers and sellers would be wise to consult with a REALTOR® when they need information specific to their communities.”
Every community in RAHB’s marketing area has their own localized residential market. Please refer to the accompanying chart for residential market activities in select areas of RAHB’s jurisdiction.
*Seasonal adjustment removes normal seasonal variations, enabling analysis of monthly changes and fundamental trends in the data