
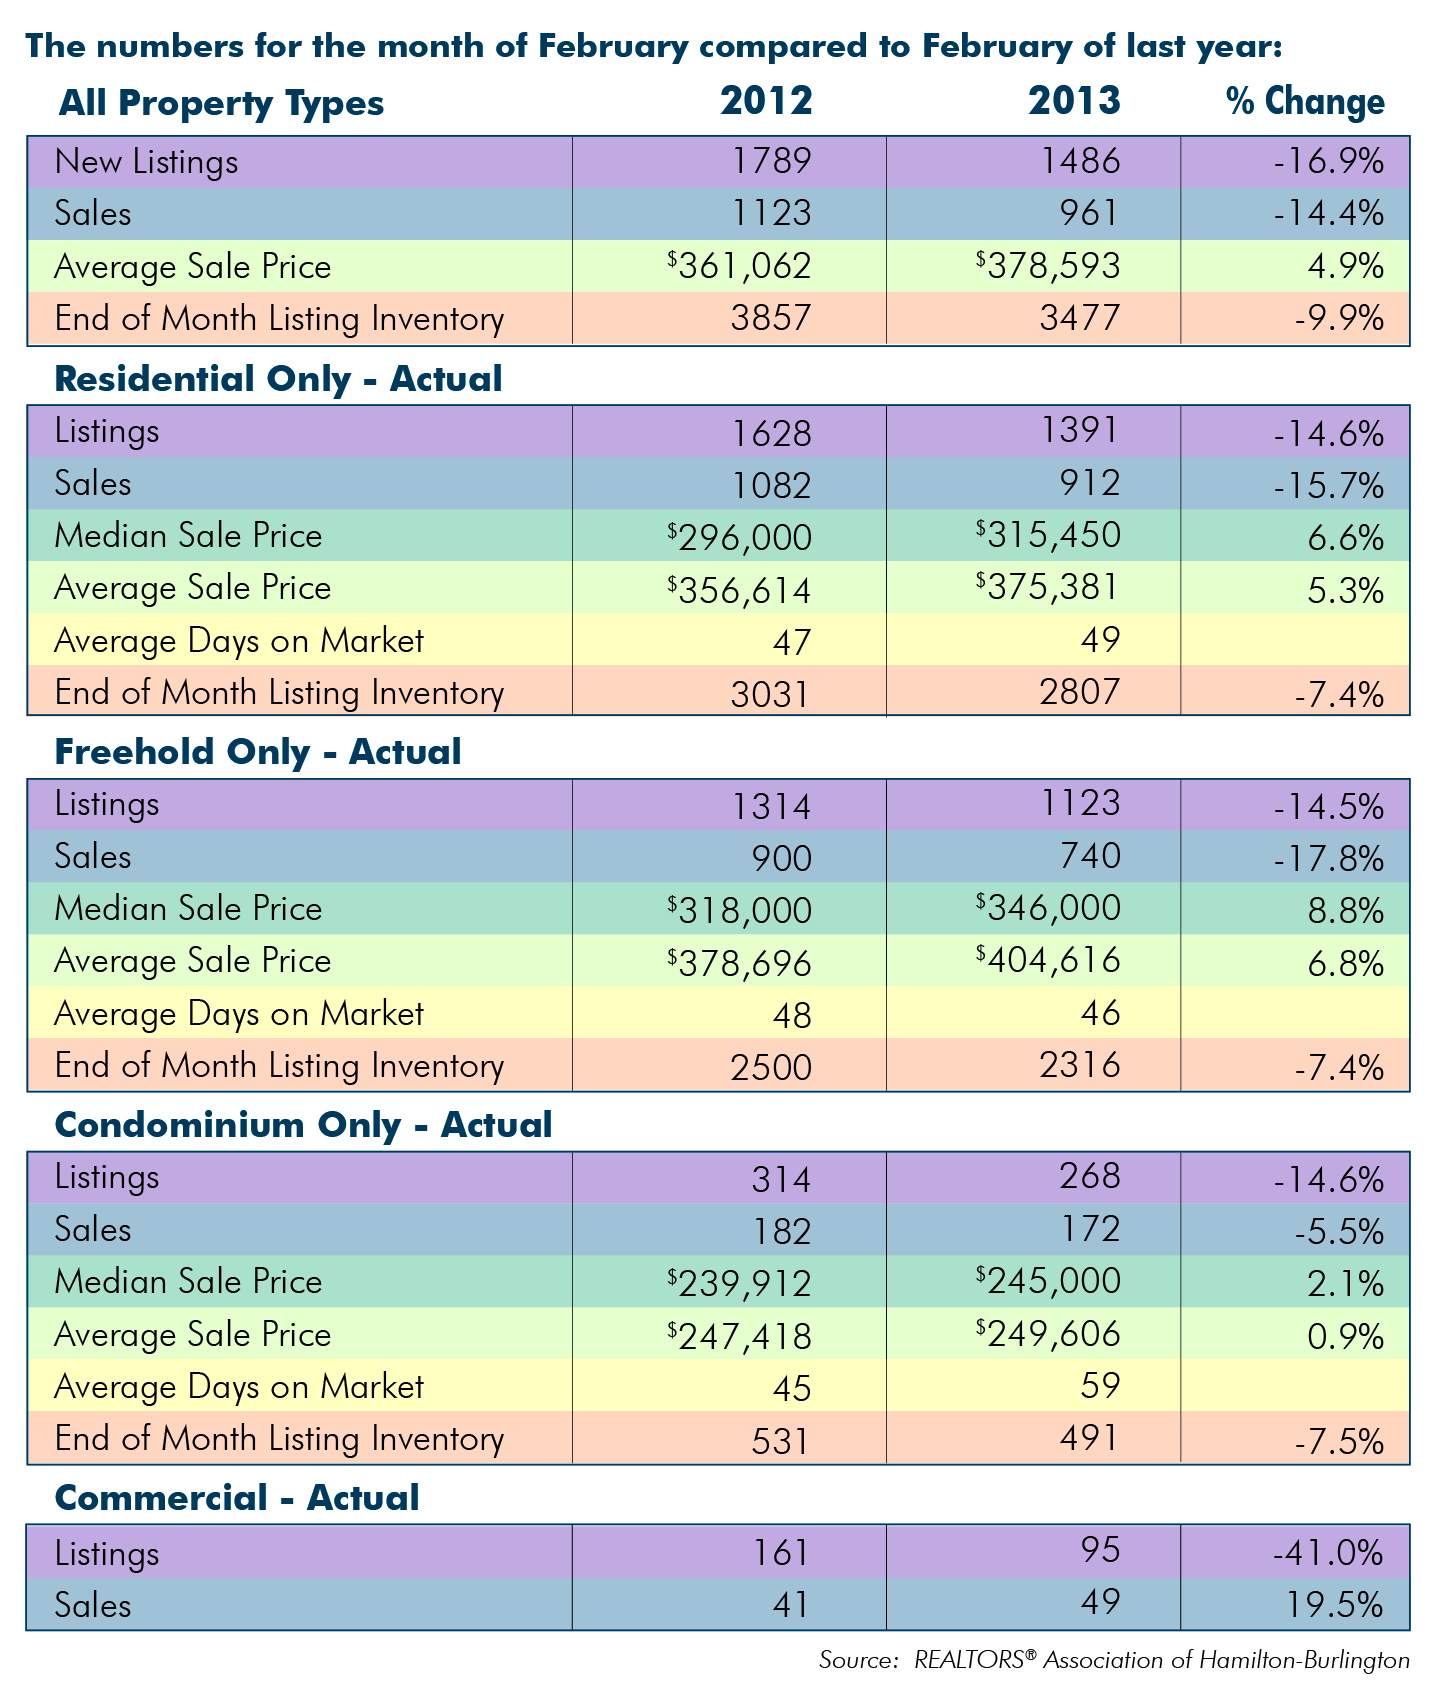
The REALTORS® Association of Hamilton-Burlington (RAHB) reported the average sale price for all property types in February was 4.9 per cent higher than same month last year.
There were 961 property sales through the RAHB Multiple Listing Service® (MLS®) for the month of February, representing a 14.4 per cent decrease in sales from the same month last year. RAHB also reported a 16.9 per cent decrease in listings compared to the same month last year.
“Last February had one extra day thanks to being in a leap year, so we expected this February’s sales to be a bit lower in comparison,” said RAHB CEO Ross Godsoe. “but this year’s sales were not only lower than last year’s but also below average for the month. Does this constitute a downward trend? It’s too early to say. We should have a better idea at the end of the first quarter.”
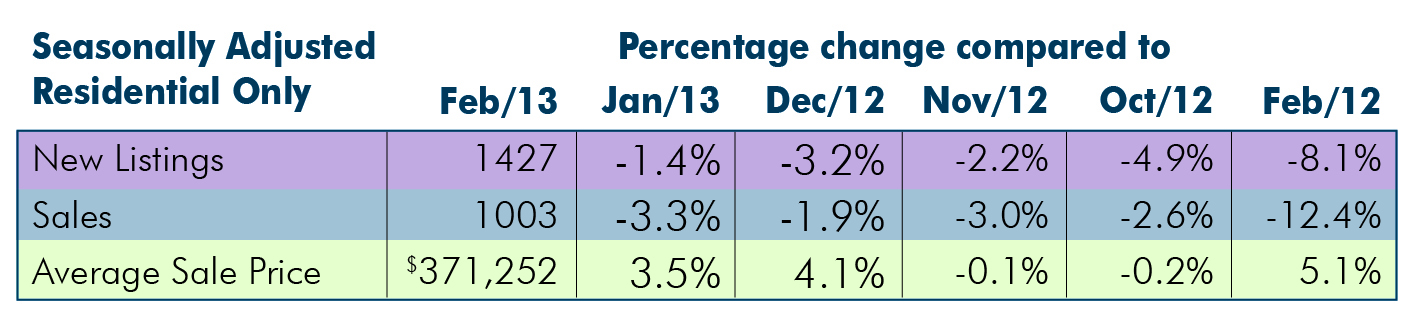
Seasonally adjusted* sales of residential properties were 12.4 per cent lower than the same month last year, with the average sale price up 5.1 per cent for the month. Seasonally adjusted numbers of new listings were 8.1 per cent lower than the same month last year.
Seasonally adjusted data for residential properties for the month of February, 2013:
Actual overall residential sales were 15.7 per cent lower than the previous year at the same time. Residential freehold sales were 17.8 per cent lower than last year; the condominium market saw a decline in sales of only 5.5 per cent. The average sale price of freehold properties showed an increase of 6.8 per cent over the same month last year, while the condominium market saw an increase of just under one per cent when compared to the same period last year.
The average sale price is based on the total dollar volume of all residential properties sold. Average sale price information can be useful in establishing long term trends, but should not be used as an indicator that specific properties have increased or decreased in value.
The average days on market decreased from 48 days to 46 days in the freehold market and increased from 45 days to 59 for condominiums.
“The average days on market for condominiums is a bit misleading,” noted Godsoe. “There is one property which was on the market for an extended period of time, skewing the average for the entire property type. Without that one property, we’d be reporting the average to be much closer to the average days on market we’re seeing in the freehold market.”
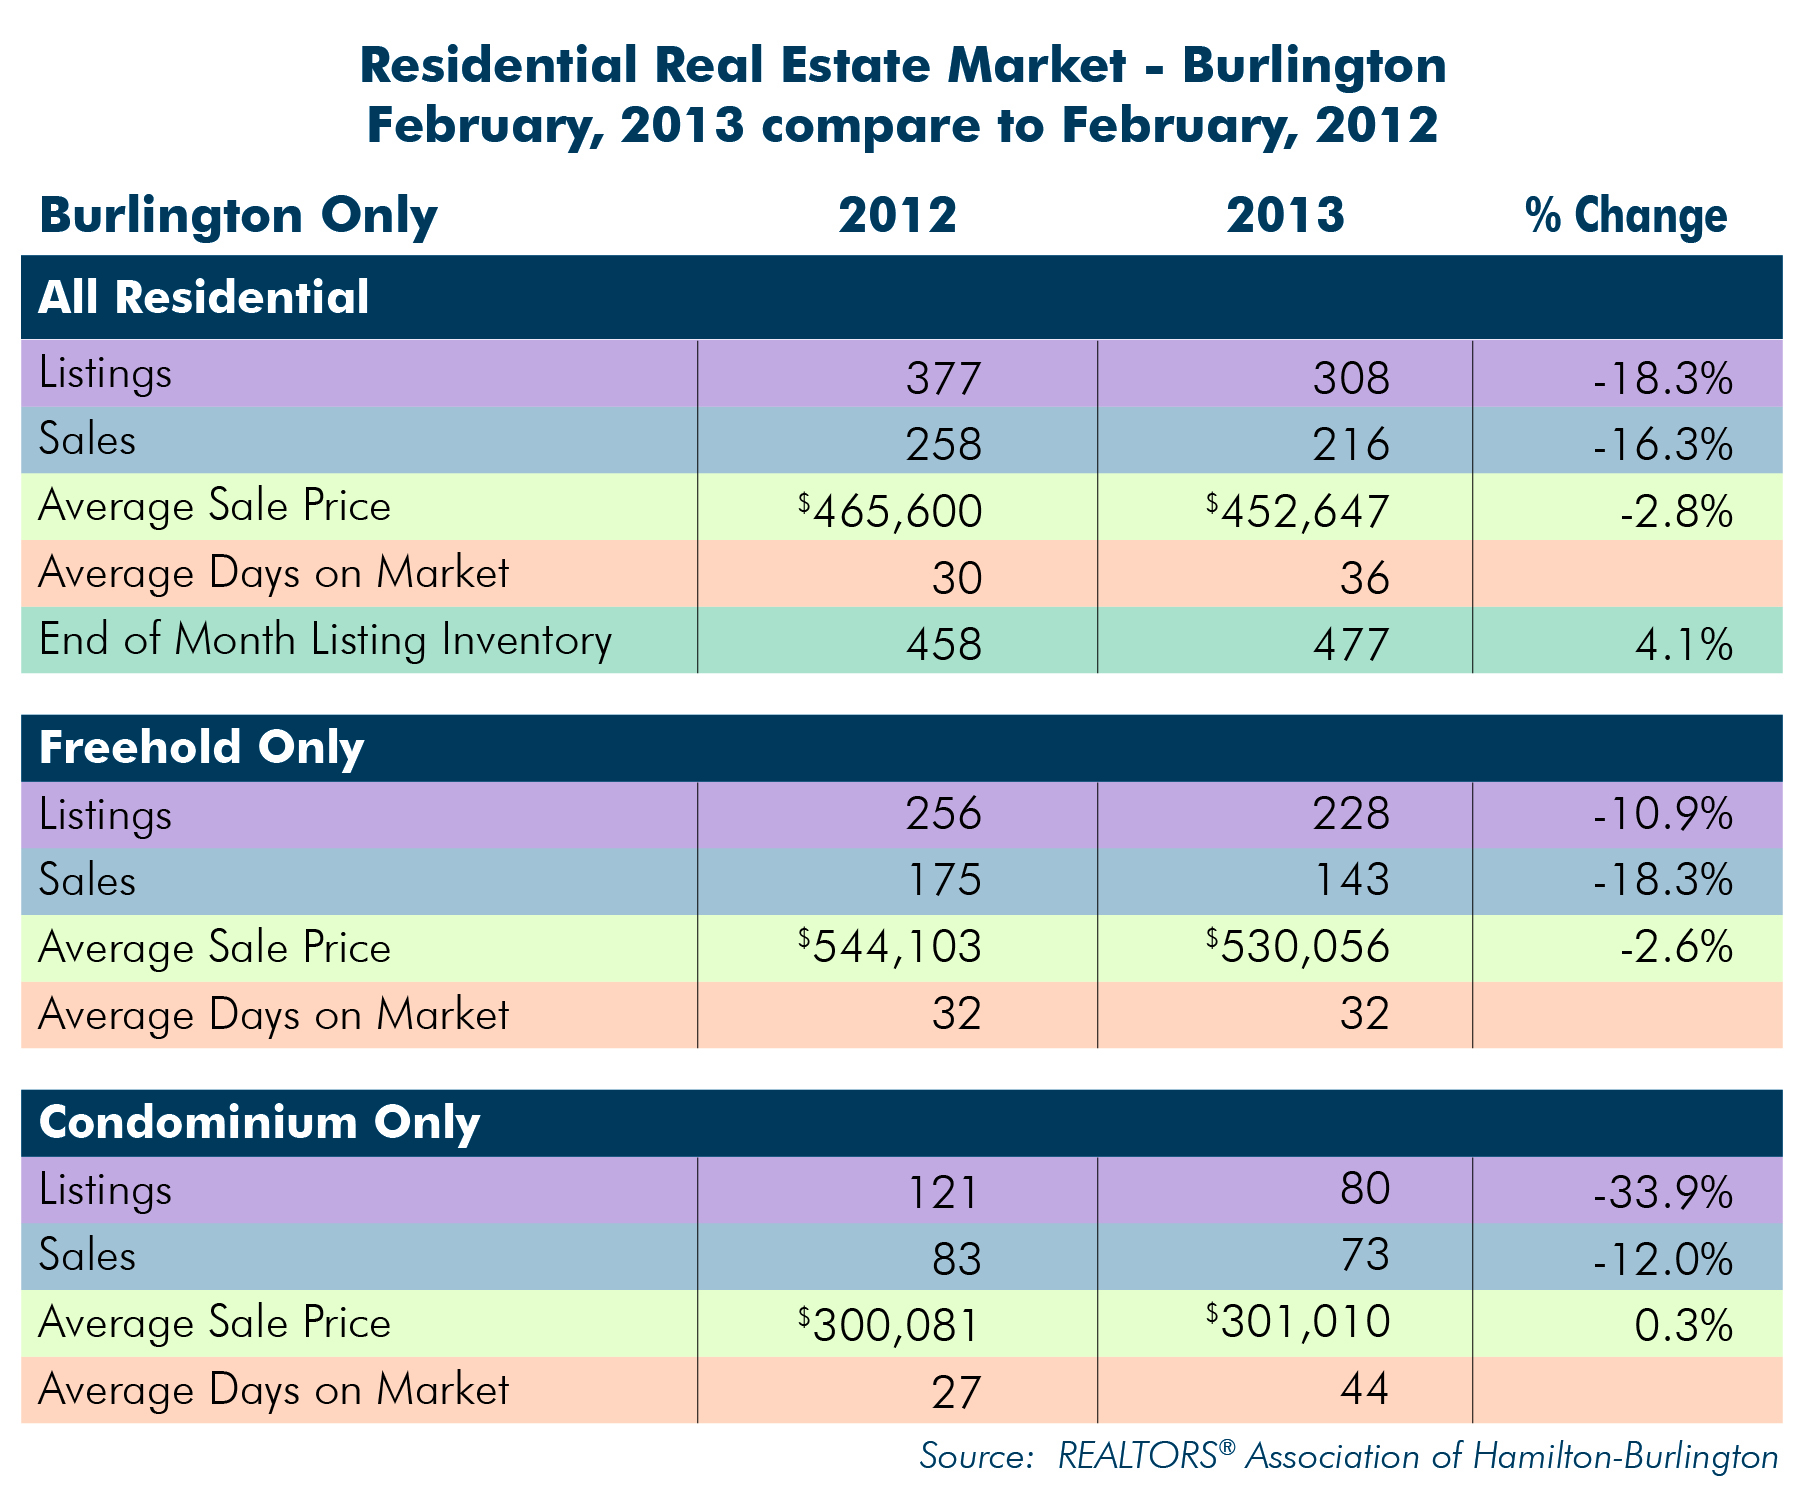
The numbers for the month of February 2013 compared to February 2012:
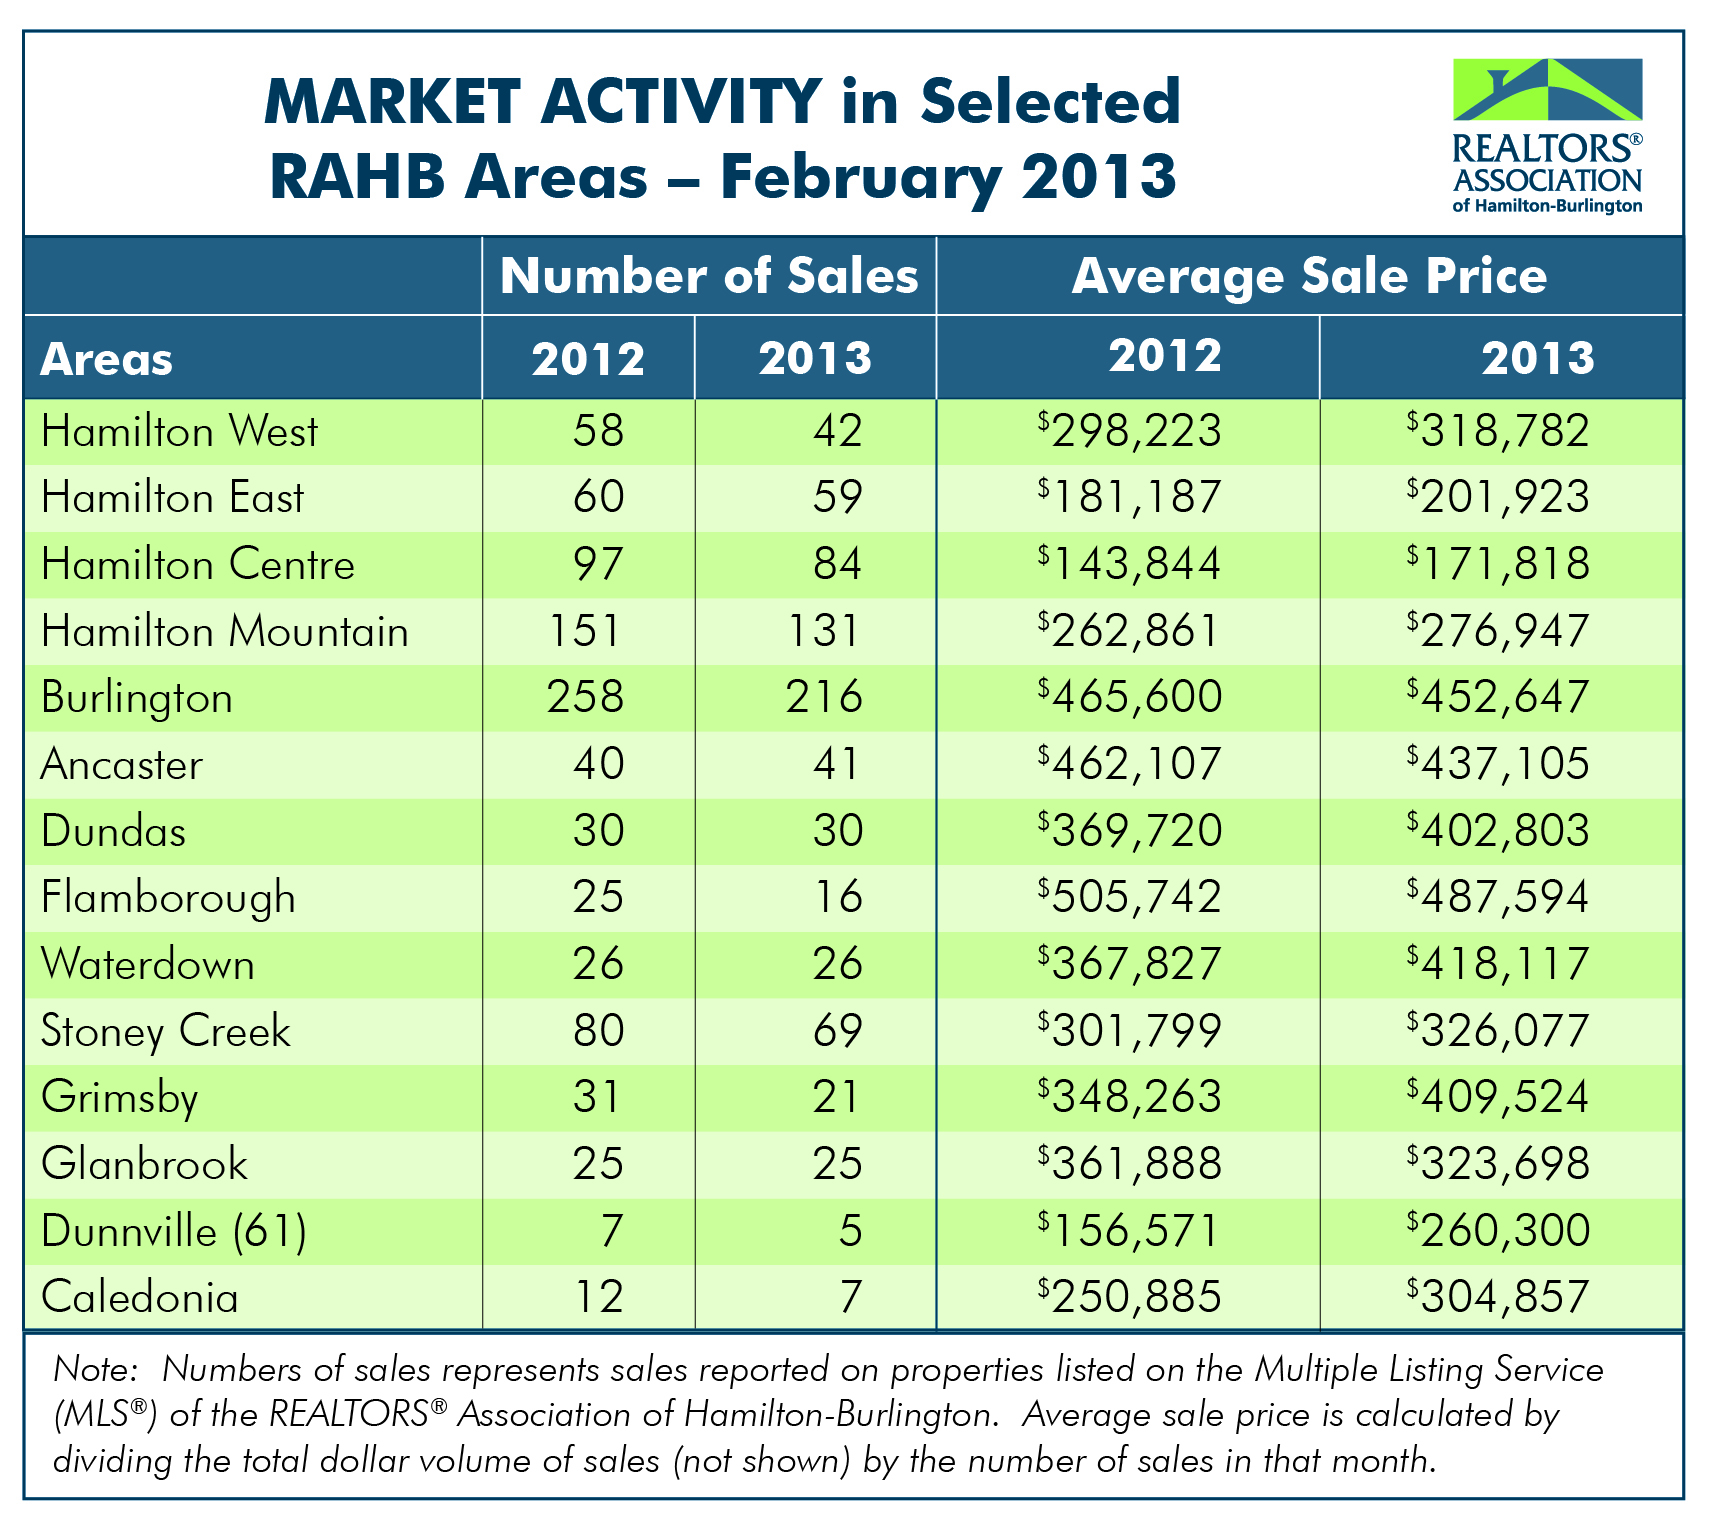
Every community in RAHB’s marketing area has their own localized residential market. Please refer to the accompanying chart for residential market activities in select areas of RAHB’s jurisdiction.
*Seasonal adjustment removes normal seasonal variations, enabling analysis of monthly changes and fundamental trends in the data.